Disy Hackathon 2022
We have quite some experience with Hackathons now:
As always we first gathered potential topics in our wiki. Employees of all departments could leave their name next to a topic to express interest. After the group finding was completed we could start hacking in the morning.
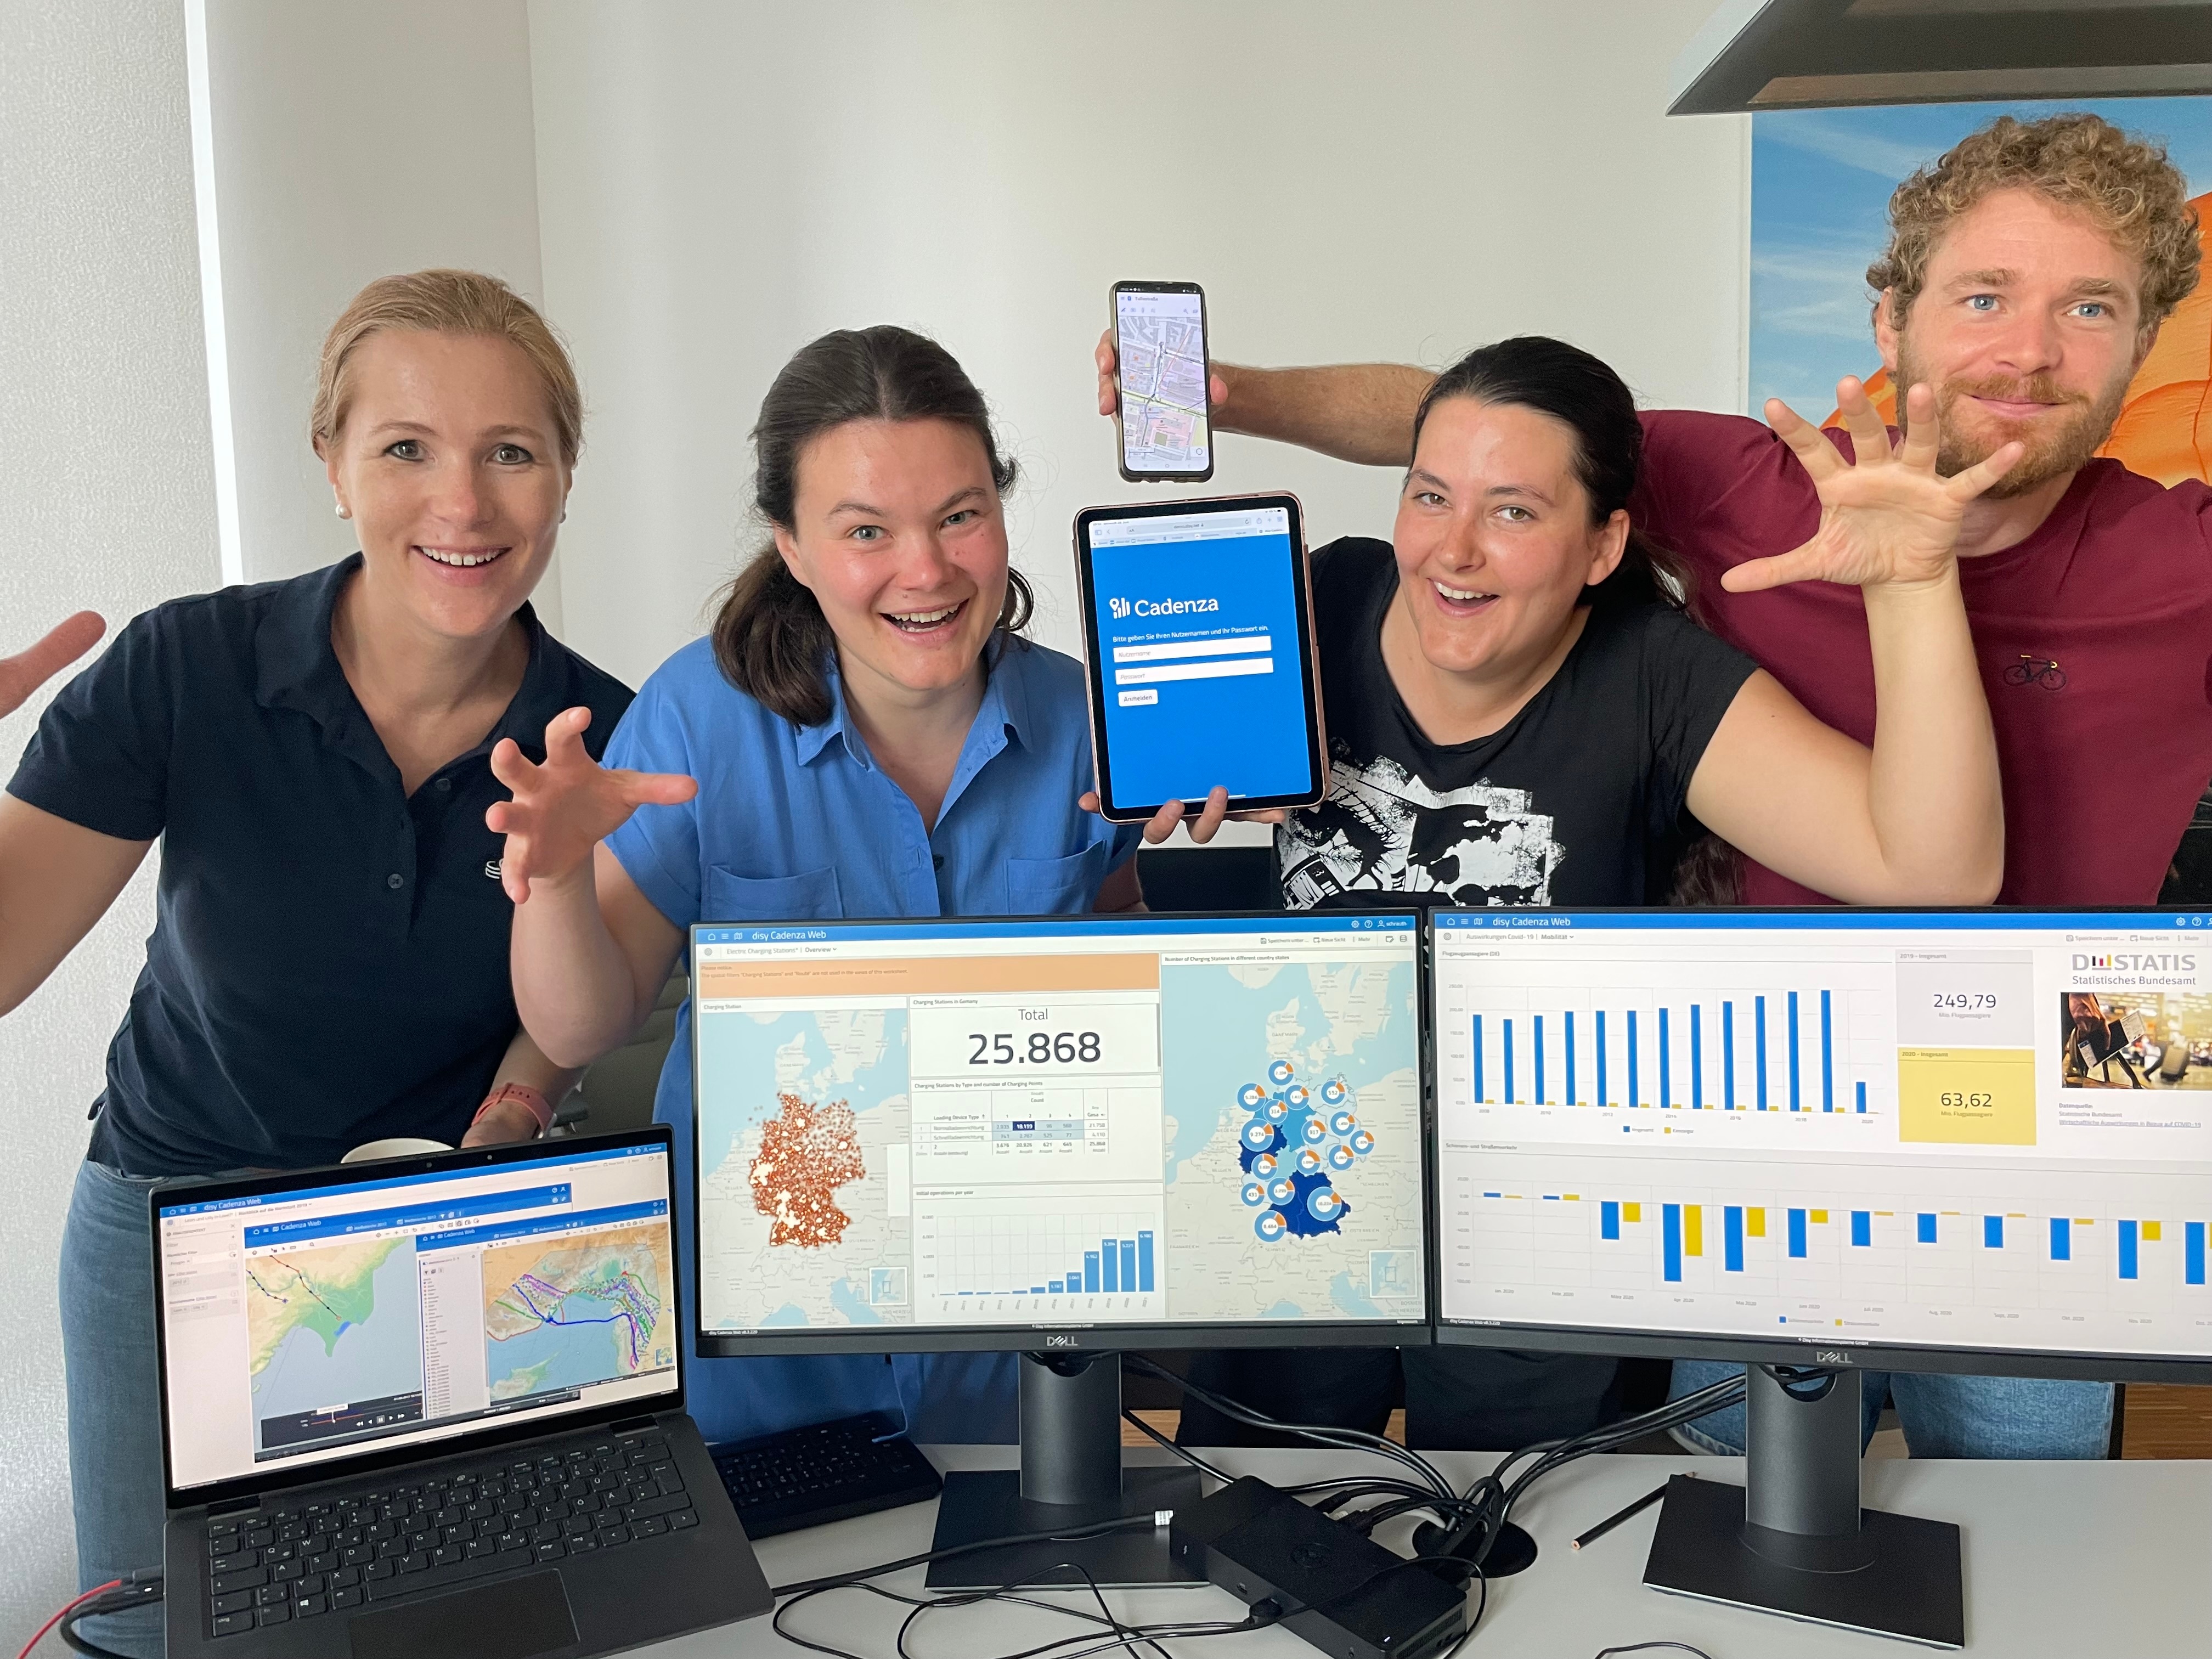
Altogether, the teams showed in two days full of ideas what is possible in disy Cadenza. Among other things, exciting concepts and prototypes for new features were created, which give us innovative impulses for future developments.
Here’s what we’ve done.
Wildfire Atlas
The idea came up after an ARTE report on the increasing danger for forest fires in Germany.
Our aim was to make overviews to get to the bottom of the fires available. Using workbooks, we provided different insights. In case of fire, we could calculate which fire brigades can reach the fire site within 10 minutes and which hydrants or water reservoirs were available within a distance of 1 km.
After some research, the forest area of Thuringia was selected. Now the collection of the necessary data began.
We imported open source data (e.g. Openstreetmap) as well as official data from state resources. The Data included helicopters, emergency landing sites, water reservoirs, forest areas, KWF rescue points, paths, hydrants and more topics. In order to get an impression of the current drought situation in Germany data from the Dürremonitor Germany was included. The following data types were used in the Hackathon: Shapefile, KML, WMS and WFS. Part of the data could be imported directly into disy Cadenza, another part had to be extended or adjusted manually in the database.
Another aim was to integrate web socket multiplex to trigger different events in workbooks. We wanted to be able to register disy Cadenza independently for an event. When the event is triggered, the workbook should build up individually.
Although not all aims could be realized in the time available, the learning effect was large, especially regarding disy Cadenza Workbooks 9.0. Using disy Cadenza for a new use case always brings a new perspective and a lot of fun.
Let’s put the oil industry under some scrutiny
As a customer you occasionally have the gut feeling that companies are optimising their profits at your expense. A classic example in the general public is the oil industry, especially when it comes to the prices at the gas stations. A feeling is just a feeling but if you want real proof, you must crunch the numbers to provide some analytical evidence. That’s what we set out to do, trying to find some anomalous behavior between the prices of crude oil and gasoline. To analyse the data, we set up a data analytics framework based on Python and JupyterLab in our cloud. Data and code were organised in a standardised way using the CookieCutter approach. The ClearML framework was used to track all data processing and analytics allowing to log, share and version all experiments and to instantly orchestrate corresponding pipelines.
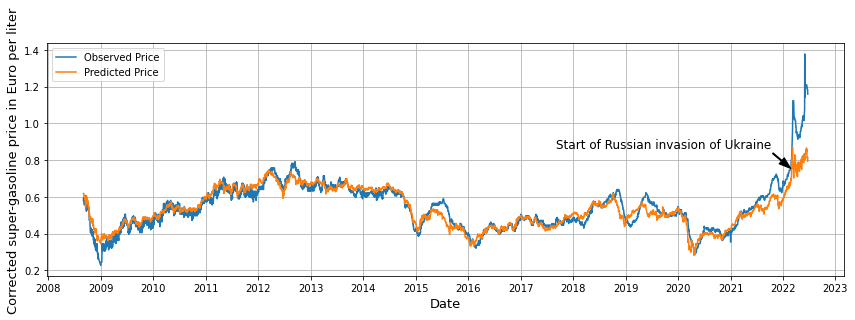
So, the outcome of our analysis? The gut feeling was right! We found an anomalous behavior between the crude oil and gasoline prices, especially since the Russian war against Ukraine. This is clearly visible in the figure below, which shows the (tax corrected) observed and predicted gasoline prices as function of year. The prediction is based on a linear model between crude oil and gasoline prices, which did a very good job in the past.
Polyglot Cadenza
Analyzing data across different databases? - It’s possible with disy Cadenza and Foreign Data Wrappers!
The situation: We consider data on three different databases: An Oracle database, a Postgres database - both relational databases - and a nonrelational database, a MongoDB database. On each database there is data containing different information about one topic. Now, we wanted to join this data to obtain the information we have about this topic all at once. And of course, we wanted to get this information in real time, so an ETL-process does not help. But how is this possible?
Our solution: We made disy Cadenza polyglot by using Foreign Data Wrappers!
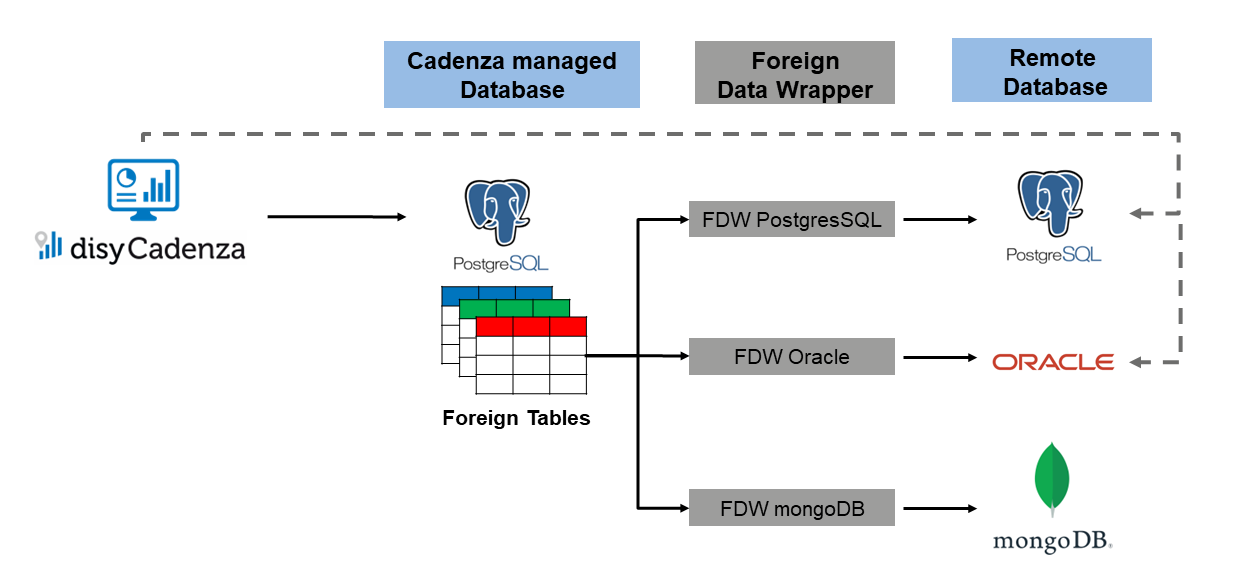
How we did this? We introduced a central Postgres database. This database accesses the data on the three remote databases mentioned above using Foreign Data Wrappers and being connected to disy Cadenza. Thus, disy Cadenza is able to join the data on these databases via the central Postgres database and analyze it altogether. Performing a query in disy Cadenza looking for unstructured data or combining data using one query across different databases is not an open problem anymore!
Releasing Cadenza BV into the wild
Operating disy Cadenza with some identity and access management is not uncommon. It is also not uncommon for grown customer environments to not yet have a centralised authentication solution. We are facing a few customer environments where modern authentication methods are already established, whereas in many environments a mixture of different user and group directories and databases still must do the job.
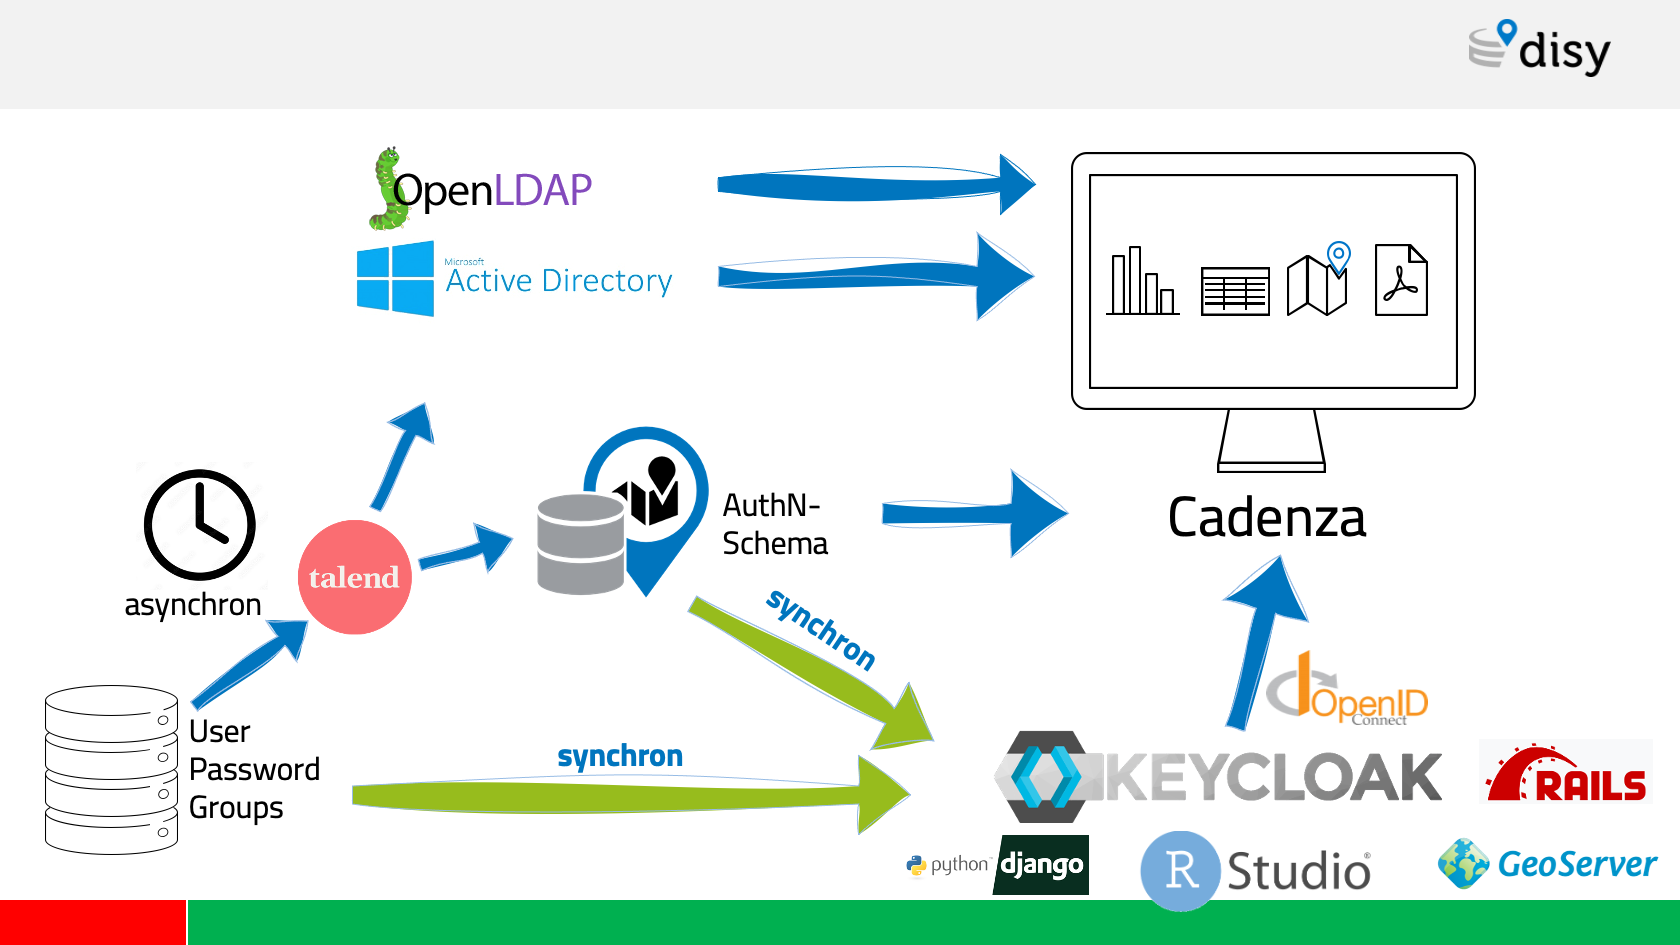
In the future, we would like to rely in such situations on Keycloak - an open-source authentication solution driven by RedHat. Keycloak provides a modern authentication layer with OpenID-Connect and at the same time offers the possibility to connect various existing user and group directories. Keycloak then proxies those “grown structures” and provides them as a single authentication and authorization interface to disy Cadenza and its related web applications.
Within two days hacking Keycloak and disy Cadenza, we have proven that we can raise literally any dusty user directory to the level of a modern authentication and integrate it with disy Cadenza. Creating and maintaining ETL processes as well as redundant data storage of users become obsolete and we can finally benefit from true single sign-on. This is how user management makes fun!
Cadenza over Cadenza
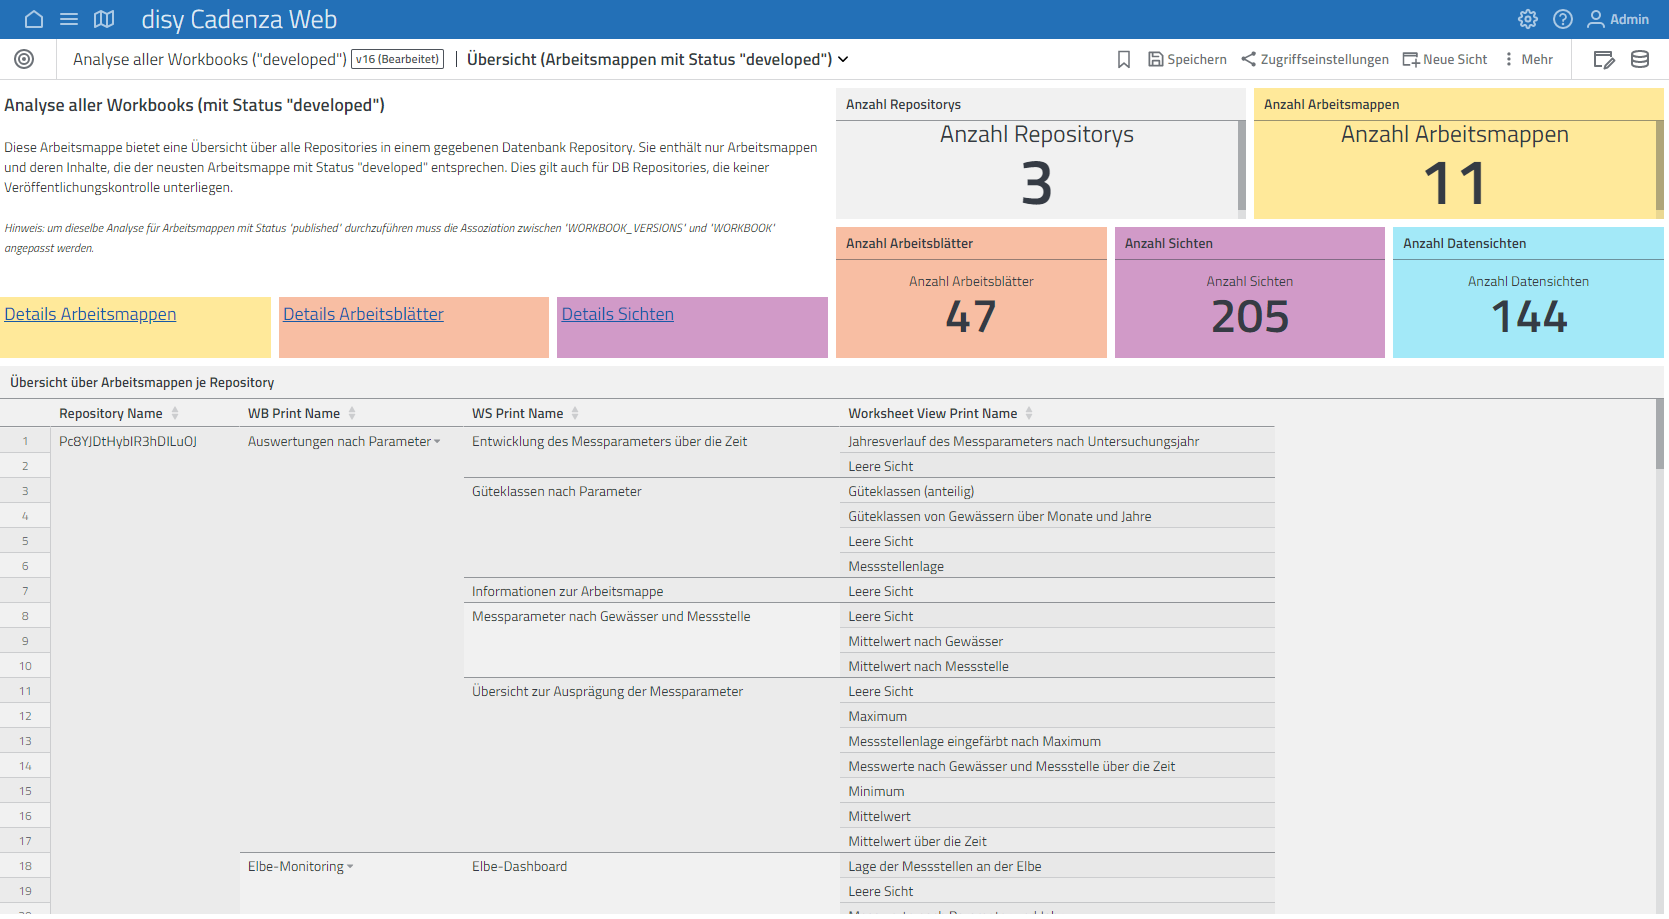
disy Cadenza is developing really fast. Up to one year ago all of the configuration was stored in XML files. Now, with disy Cadenza Spring ‘22 the data configuration is saved in different databases. Objecttypes and workbooks are stored in the database-repository, data from self-service imports are stored in the cadenza-db, groups and roles are stored in the accessmanager-db. Data models of these databases have more than 60 tables, which is a lot of stuff, and although the management center already gives you all kinds of information about your configuration, there are still some points where you don’t have an overview of the configuration so far. We created this overview with workbooks. With “Cadenza over Cadenza” we developed a repository where you can see what users configured in Cadenza so far. For example you can analyze which workbooks are within a repository and which work sheets are within a workbook or you can get an overview of the system rights of a dedicated user group.
Of course with “Cadenza over Cadenza” you can also analyze other data. In one workbook we made information from disy Cadenza classic XML repositories visible. We found out that a customer has a repository with more than 500 data sources.
In our third part we tackled the question which analyses a user might have missed so far. Therefore, we extracted metadata of a customer database via SQL and were then able to analyze which tables actually existed in the customer database and what the data quality of these tables were.
We are flashed, we have so many opportunities to analyze data from disy Cadenza with workbooks. It’s amazing.
Do It Smoothly Yourself
Git, Docker, Kubernetes, Cadenza’s configurations, CI jobs, … Those are names that have made more than one solutioneer shiver or that trigger painful memories. As most of us did not have computer science education, having all of these tools around disy Cadenza and our projects can be very challenging. Moreover, the DevOp, IT and other technical teams can not always be there for us. To gain our independence, we often learn it the hard way, after hours of trial and error, without a real clue on how to proceed. Yet, when one finds a solution, this fresh knowledge has nowhere to go and does not spread as it should to the rest of the staff. While some would say “No pain, no gain”, these tasks are common to all solutioneers, and the lack of documentation around them keeps on the general struggle.
“Do-It-Smoothly-Yourself” was a project of this Hackathon to address this issue. An “All-in-one-place” hands-on guide on Confluence where all solutioneers could go to find support and smoothen their work. It’s a collection of how-tos and code snippets to follow through, ordered according to a project’s lifecycle:
- setup and configure disy Cadenza
- setup a GIT repository
- setup a (PostgreSQL) database
- create and work with Docker applications
- use continuous Integration with Gitlab-CI
- deploy on Kubernetes and use Rancher
We hope that this guide will be useful and others will join the train to further enrich it, as Disy moves fast. Let’s make this guide the must-have we’ve all dreamt about! Too good to be true? NO! With this guide, We Can Do IT!“
The Disy Colleague Finder
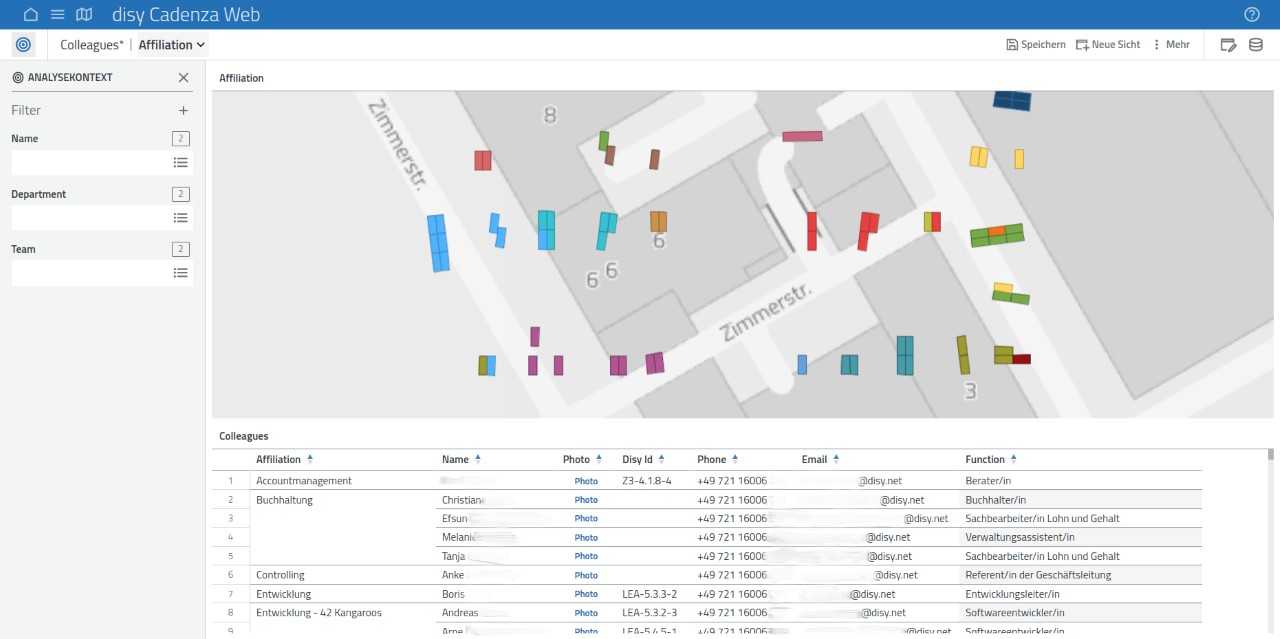
This tool helps to answer questions about the location of a colleague I am looking for - for example where the workspace of the person is located in the office, or if the person is in the homeoffice or absent.
For this we deployed an instance of disy Cadenza Web and a PostgreSQL DB on our Kubernetes Cluster. We used the API of Personio to extract information about our colleagues and transferred them into a Database. The Data was visualized in disy Cadenza Workbooks. The information about each colleague was mapped to the coordinates of his/her workspace in the office and shown on a map that was integrated with a Geoserver. With the addition of a Custom-Button each colleague can set his/her status to office or home office in disy Cadenza.
Intermezzo - A Code Review Tool
In the software development philosophy at disy, the Code Review is an integral part of our process. Currently we’re using Atlassian Crucible for this, but since the tool is already EOL we’ve been looking for alternatives for quite a while. Sadly, there seems to be a lack of self-hosted Code Review Tools which are both able to handle large code bases and fit our workflow. During the Hackathon our team investigated the possibility to create our own tool from Scratch. The Result was a minimalistic program which will serve us as a starting point for an ongoing internal project which will hopefully emerge as a replacement for Crucible in the future.
Chart Innovations
You know you should "eat your own dogfood”. Because of this we use disy Cadenza in our daily work for planning, evaluating and analysing our data. But it’s not the only reason we do this, it also makes theses tasks simple.
We used the Hackathon to try out how we could offer disy Cadenza users even more options for visualizing and analyzing data in disy Cadenza Workbooks. With five additional diagram types, we prototypically demonstrated how correlations from internal project management, development controlling, or even evaluations of extensive protocols can be displayed even more clearly.
- Scatter Plot to visualise data with two features and identify correlations, e.g. correlation between performance test duration and error rate.
- Gantt chart for time-bound activities, essential in project management.
- Stacked area chart, e.g. to show the remaining effort and budget of a project.
- Treemap, to see the structure of a project composed of Epics and Stories.
- Layered Column Charts, multiple measures per dimension, in great memory of an old disy tracking tool.

Interactive Cadenza Introduction
disy Cadenza is a huge piece of software with a lot of complex features. New users can have a hard time to get started. And we at Disy aim for a lot of new users, right? 😉
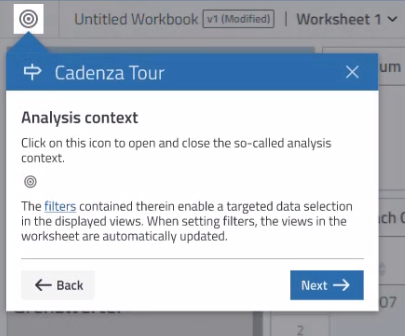
So we were thinking of how we could improve this “first contact” experience for new users: Wouldn’t it be nice to replace the static introduction contents on disy Cadenza’s default welcome page with an interactive introduction that guides the first steps of a user through the software?
We implemented a prototype for just that: Based on the Shepherd.js library we added an interactive introduction to disy Cadenza, featuring helpful contents and a Cadenza-like design. The introduction can be started both automatically (based on configuration and user settings) or manually using links in the help menu and on the welcome page. Let’s see whether this will eventually make it into a disy Cadenza release 😊
What was amazing about this Hackathon was the big interest in the topic: 8 people from 5 departments participated in this race, which allowed some decent interdisciplinary collaboration. Awesome! 😎
Guiding kitten fright event response teams
Disasters require a swift and adequate response to threats: guiding limited resources for maximum effect, even when essential information is buried in irrelevant messages. Lots of irrelevant messages.
We chose kitten fright events as the disaster-type: cats getting stuck in trees simultaneously. Many cats. As each cat requires a full fire brigade — otherwise it would feel insulted “I’m not even worth a full team to you? No chance I’ll come down! Hsss!” 🐈 — this requires precise resource allocation. And they must be saved before dusk.
To simplify guiding a data-driven response we extended our Elasticsearch support with experimental statistical measures that make it much easier to strip out the noise.
We then simulated 500.000 geolocated social media messages — originating close to trees in Karlsruhe — and filtered them with Elasticsearch to find only the 500 reports about cats stuck in trees. Then we mapped these to street names with reverse geocoding and used the experimental statistics-support to estimate the expected actual number of cats per street.
And that’s how to send the appropriate number of fire brigades to save the furballs before darkness falls.
From Data Enrichment to Advanced Analytics with disy Cadenza and Elasticsearch
Elasticsearch is ideal for storing large amounts of data. To gain better insights from this data, analysis steps can enrich it with additional information or processing results.
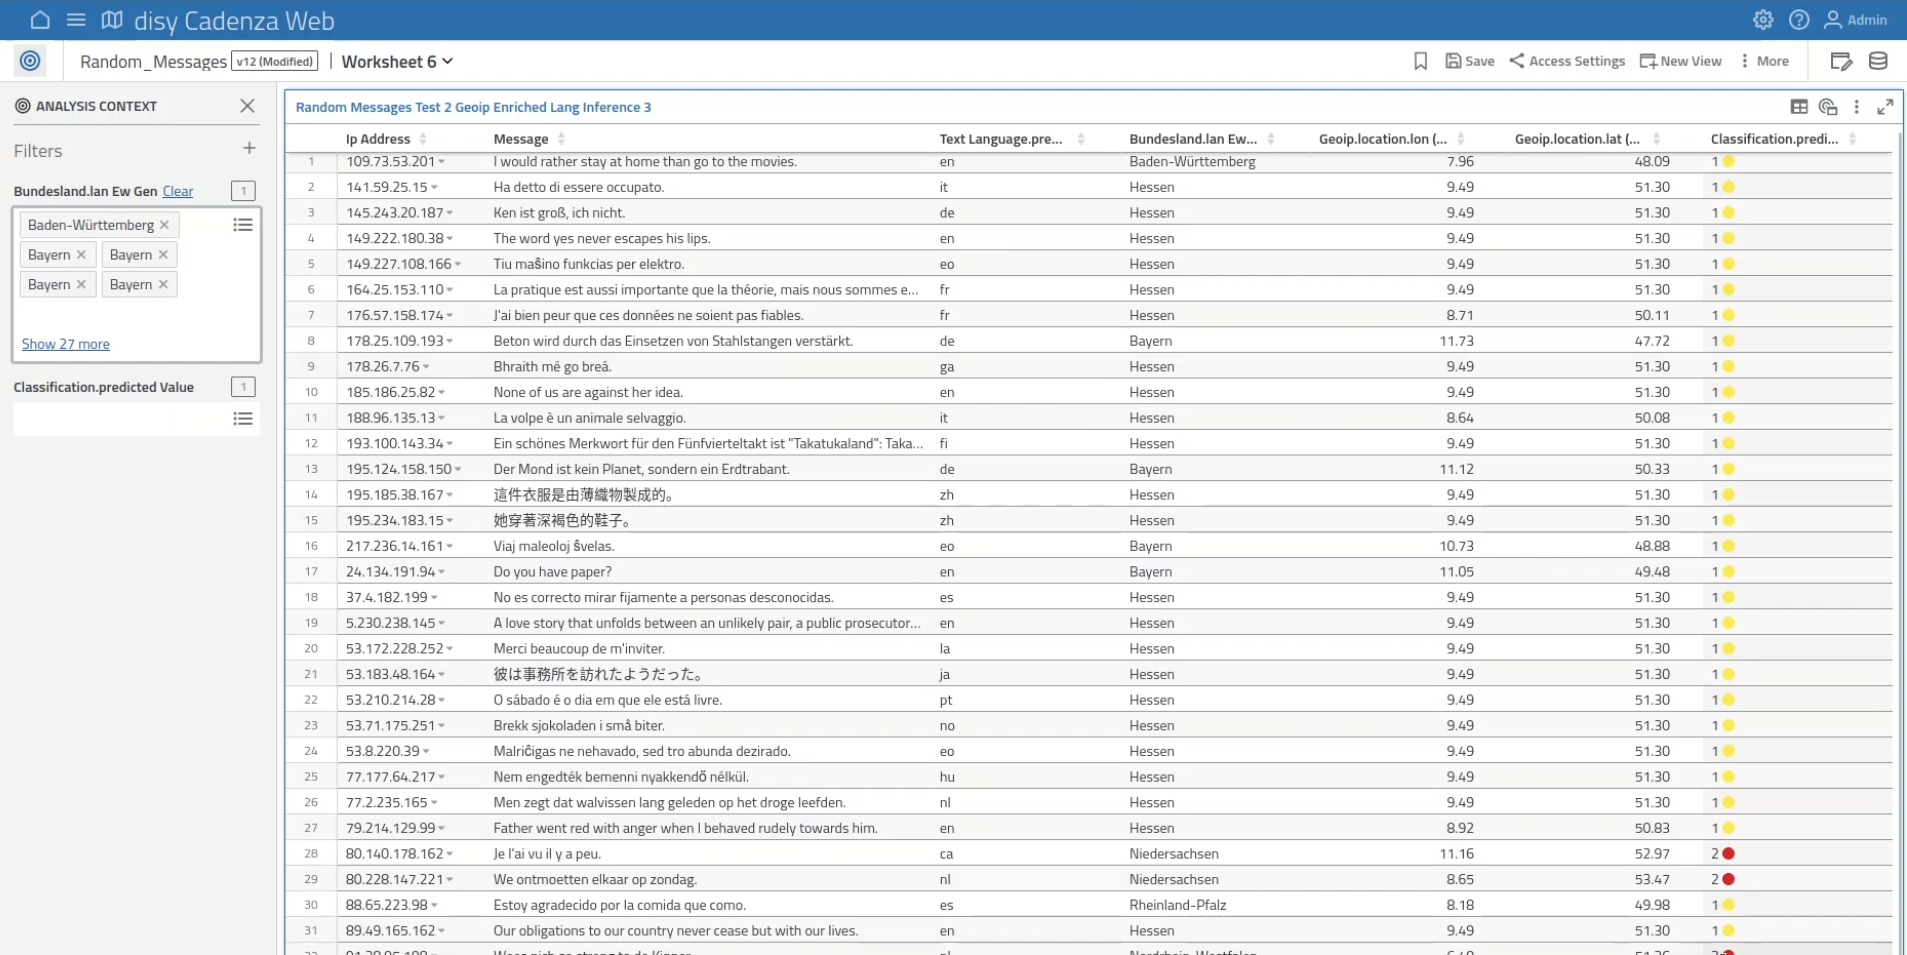
In order to trigger such enrichments directly from disy Cadenza, we configured Elasticsearch ingestion pipelines with four different processors:
- GeoIP Resolution: This pipeline used the builtin geoip processor to resolve a position from the “IP_address” field.
- Language Detection: This pipeline analyzed the “Message” field and annotated the data with the detected language using an according pre-trained NLP model.
- Spatial Intersection-based Annotation: This pipeline took the geo information that was generated by the GeoIP Resolution step above and added a field containing administrative units based on spatial intersection of the geoip positions and the area geometry of the administrative units.
- Custom ML Model: In the final pipeline, we assigned a class to each record based on the classification results from a custom-built machine learning model (Decision Tree), that was trained using the features from the previous processing steps. Once uploaded, the trained model runs self-contained on the ES cluster.
The individual enrichments were triggered through the data manager and sent to the Elasticsearch cluster through the _reindex respectively _update_by_query APIs. The status of the asynchronously running processes were monitored using the _task API and visualized in disy Cadenza. Upon completion, the disy Cadenza object types were seamlessly updated with the new field(s) which appeared in the data manager and could then be used in disy Cadenza.
Automated Objecttype network creation
One of disy Cadenza’s strengths is the possibility to integrate existing data from various data sources including different database products to eventually analyze it with disy Cadenza’s rich set of mighty features, like table, map and chart visualizations. Starting with version 9.0 disy Cadenza offers a new feature to create individual Objecttypes based on user-chosen database tables directly over the disy Cadenza Web UI. For single Objecttypes and small networks this is a strong and very helpful feature and allows the user to quickly integrate and analyze data.
While this alone is a game changer, the creation of the initial Objecttype is limited to basic information, leaving it up to the user to configure primary keys and connect individual Objecttypes via associations to build the networks that form the base for disy Cadenza’s powerful data analyzis tools. For more complex or simply a very big number of database tables the creation of such data mappings, although already assisted by disy Cadenza, might form a bottleneck. This especially is true, when at this phase it is not yet clear what data (or database tables) contains the relevant information.
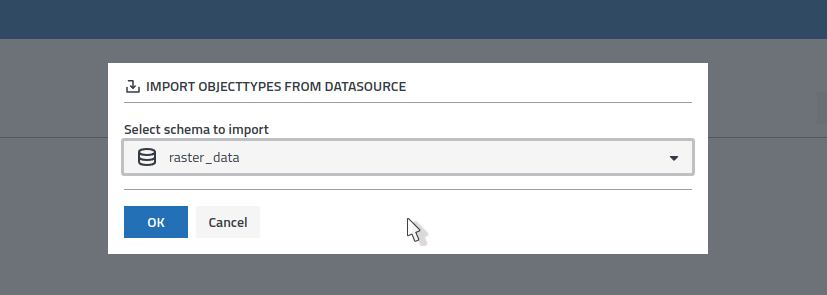
In this project we built a prototype feature that allows the user to automatically create Objecttypes of multiple database tables by specifying a datasource schema and analyze them to automatically build up their Objecttype networks: disy Cadenza takes a look at the table constraints to identify primary keys, create attribute relations between primary keys and geometry attributes and set up associations between Objecttypes. All in one go!
This not only can help to save a lot of time for setting up already identified Objecttype networks, but also move the search for the relevant data right into disy Cadenza, without having to carry the risk of loosing time on Objecttype creation for database tables that don’t offer any relevant information.
Fin
We had a lot of fun working on these topics.
Until next time!


