The Apache Sedona Minimal Environment
Introduction
Apache Sedona (formerly GeoSpark) provides a cluster computing system for loading, processing and analyzing large spatial data with high speed and low memory consumption. It extends the Resilient Distributed Dataset (RDD) from Apache Spark. Equivalent to a RDD, a Spatial RDD (SRDD) is formed of collections of objects partitioned across machines in a Spark cluster. It allows the use of spatial data in Apache Spark. A SRDD can contain spatial objects and Apache Sedona provides efficient parallel implementations of the most widely used spatial query operations that follow the Open Geospatial Consortium Standard.
A major advantage of Apache Sedona is its ability to load data into memory and physically split in-memory copies to a lot of equally sized partitions across work nodes of a cluster, while still preserving spatial proximity of the data. This is done by grouping spatial objects based on their spatial proximity. This leads to fast query speeds. More technical information and benchmark analysis can be found in the publications from the Arizona State University Data Systems Lab and on Sedona’s website.
As someone who is interested in large-scale spatial data you will get excited and want to immediately test some queries and load your own data. The Apache Sedona community already provides a convient way to get started with a custom computing environment using binder. This a fascinating feature and an easy way into the Apache Sedona world.
However, we have been in the situation where we would like to have some kind of minimal environment at hand, which we could use locally for small tests. As a result we gathered relevant dependencies and created a project, which forms a minimal environment for Apache Sedona: Apache Sedona Minimal Environment.
Requirements and Setup
Our requirements were manageable: we would like to have a portable environment where we could run tests on average-sized datasets. Moreover, we wanted to use Jupyter Notebook.
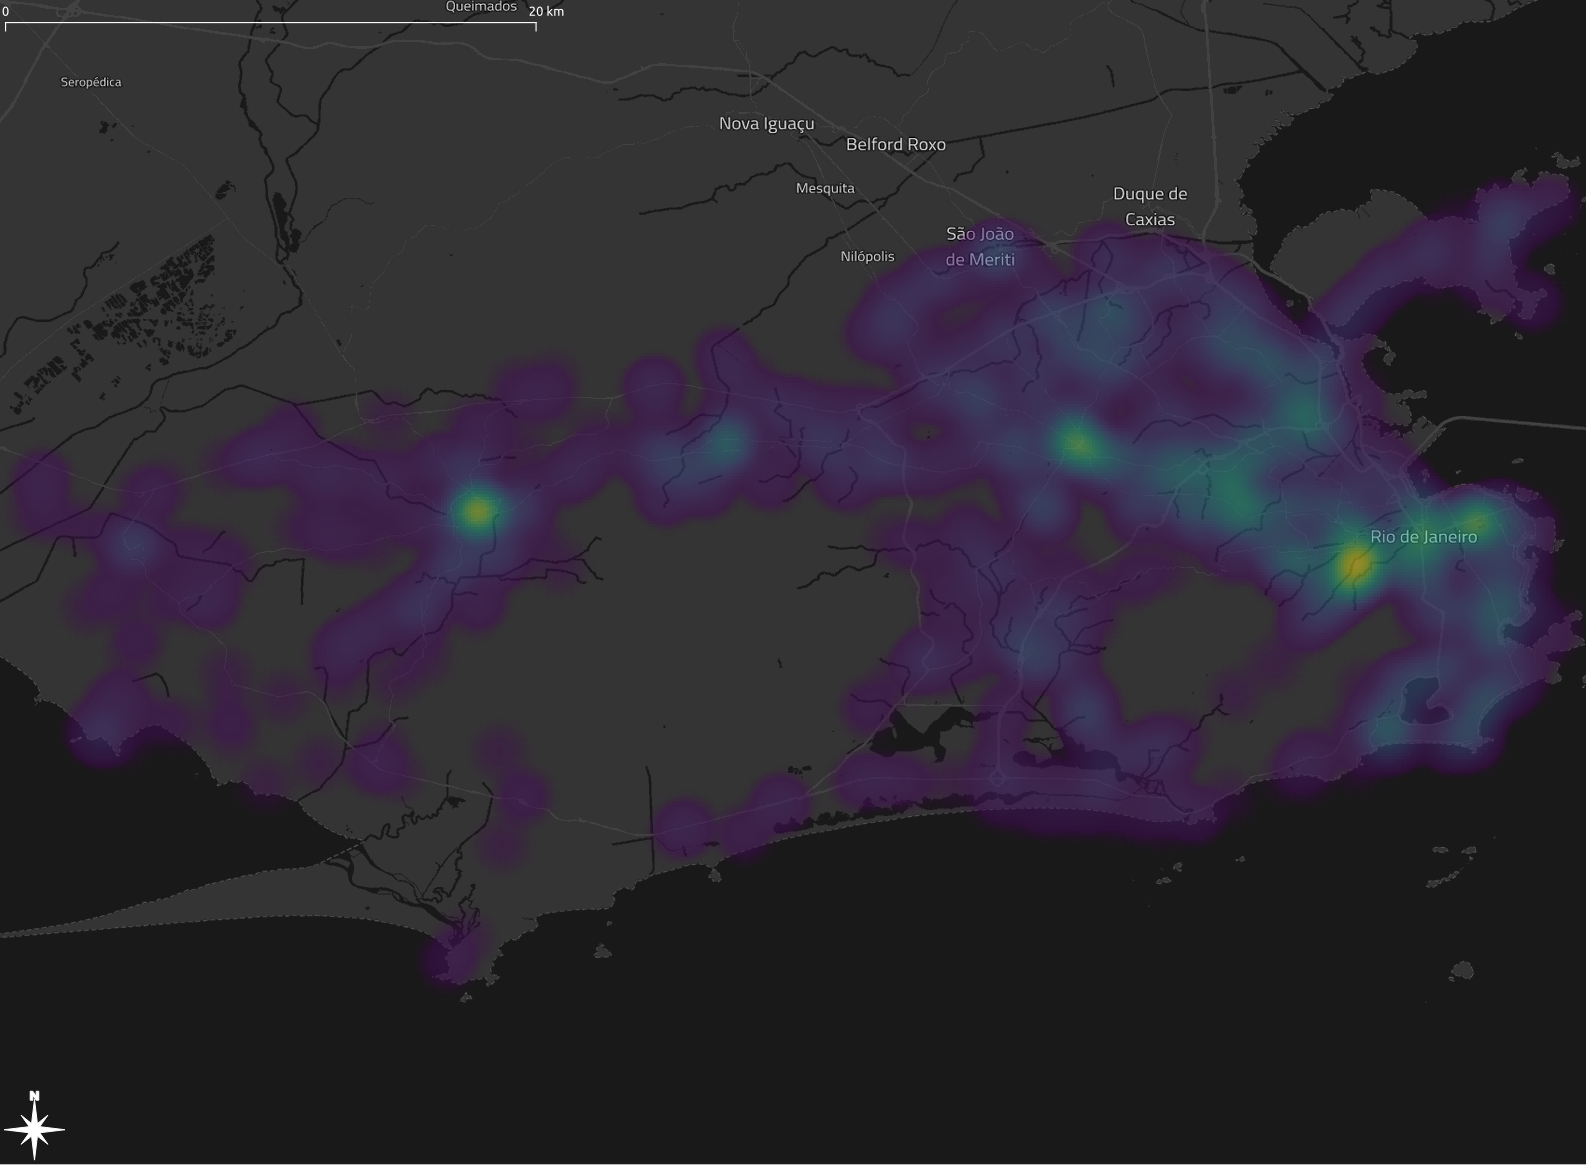
We decided to build on the Dockerfile from jupyter/pyspark-notebook and extend it with Python bindings for apache-sedona and geopandas. Finally, we added some data (positions of buses in Rio de Janeiro) and a notebook as a starting point. Our custom Dockerfile can be pulled from dockerhub.
Getting started
After checking out the repository you can call the docker-compose file with the following command. This will start the container directly:
sh
docker-compose up
As an alternative you can start in daemon-mode and check for the url with the command docker logs sedona_jupyter-spark_1.
You can stop the container with ctrl + c.
In your terminal you should see the following output:
jupyter-spark_1  |     To access the server, open this file in a browser:
jupyter-spark_1  |         file:///home/jovyan/.local/share/jupyter/runtime/jpserver-7-open.html
jupyter-spark_1  |     Or copy and paste one of these URLs:
jupyter-spark_1  |         http://f84f36462087:8888/lab?token=57bebb5120df1bb027989359cbcf8edc42b64a66a3a60bb6
jupyter-spark_1  |         http://127.0.0.1:8888/lab?token=57bebb5120df1bb027989359cbcf8edc42b64a66a3a60bb6
Open the last url in a browser of your choice and you should see your Jupyter Lab environment.
On the left, navigate to work/notebooks and open the notebook sedona-minimal.ipynb.
With the combination shift + a you can run a single cell. The code of the cell will be interpreted by the Python kernel and the focus will switch to the next cell.
The second cell of the notebook will initialize the Spark session and also download the relevant artifacts for Sedona.
spark = SparkSession. \
    builder. \
    appName('appName'). \
    config("spark.serializer", KryoSerializer.getName). \
    config("spark.kryo.registrator", SedonaKryoRegistrator.getName). \
    config('spark.jars.packages',
           'org.apache.sedona:sedona-python-adapter-3.0_2.12:1.0.0-incubating,org.datasyslab:geotools-wrapper:geotools-24.0'). \
    getOrCreate()
Now you are ready to explore the Apache Sedona features. The following cells will load a .csv file of GPS records (2000 rows) and a Shapefile representing two polygons in the Rio de Janeiro area.
Summary
Please keep in mind: this is a minimal environment. You will not see the Apache Spark magic because your machine will act as a control and worker node. However, it allows you to write your own Apache Sedona queries, gather some experience and later test those queries on more powerful machines.
We developed this for the AIFER project, where we develop data fusion approaches for big spatial data, i.e. spatial social media and earth observation data.
Happy Hacking! ⌨️ 🧉
The title image by Kaileen Fitzpatrick depicting Cathedral Rock near the city of Sedona in Arizona is published under the Unsplash License.
Share via


