
JMeter Tutorial
Benchmarking Your Web Application
Want to load test your web app? Then you should know about Apache JMeter!
Getting To Know JMeter
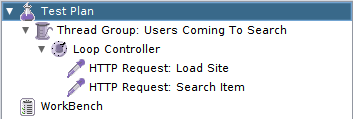
With JMeter you can create and execute test plans, which are organized as trees.
The entry points into a plan’s execution are thread groups, where each thread represents an individual user. Controllers are the meat of a test. They are children of a thread group or of other controllers and come in two variants, defining what happens and how: Samplers are concerned with what happens, they send requests (HTTP, FTP, JDBC, what have you) and wait for the response. Each individual exchange (i.e. request, response, response time, …) is recorded and called a sample. Logic controllers determine how samplers are executed, they provide common control structures like branching and looping.
While it is possible to run benchmarks that only consist of these elements, others are required for anything beyond the most trivial test plans.
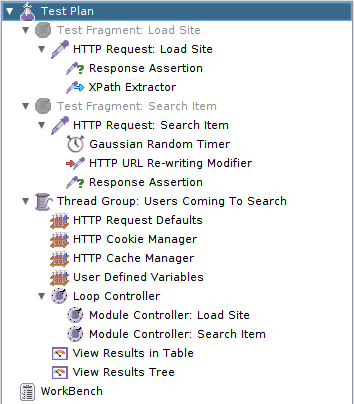
Like thread groups, test fragments are children of a test plan and contain a subtree that makes up part of a test. Unlike thread groups they are not executed directly. Instead they are included with a module controller. This structure enables reuse.
Configurations store variables to be referenced by controllers, manage cookies, act as caches during test execution, and more. Pre- and post-processors are attached to a sampler and executed right before or after it. They can modify variables that the sample is going to use or parse the response to store some information. You can use assertions to verify properties of a running test, e.g. that a response’s body was not empty.
Humans pause while browsing a site and you can simulate that with timers. Plans can be executed with or without regarding timers.
Finally, use listeners to collect and visualize samples.
You can find these items in most node’s context menu under Add. They are the blocks to build a test plan out of.
Their interaction is pretty intuitive but I would still recommend to read up on the scoping rules. Definitely do this if you use timers because here several intuitive interpretations exist and only one is correct. ;-)
Creating A Test Plan
I found it useful to start the creation of a test plan by recording an interaction with the site and then edit and structure the recorded request.
Recording
JMeter can act as a proxy and will then record all requests as samplers. The setup is easy:
- Add a recorder to the workbench: You will find the HTTP(S) Test Script Recorder under Non-Test Elements.
- Choose where to collect the samplers: Most children of the test plan can be selected as a Target Controller (e.g. thread groups, fragments, controllers).
Now you only need to edit your browser’s proxy settings to point it to JMeter and after hitting Start on the recorder all requests will be turned into samplers.
After familiarizing yourself, try these features:
You should limit what will be recorded by specifying URL Patterns to Include and URL Patterns to Exclude. If at least one inclusion pattern is defined, only requests matching these regular expressions may be recorded. A request is not recorded if it matches at least one exclusion pattern. You might want to Add suggested Excludes and improve on them to only record relevant requests. (See below under Configuration for how to get JMeter to fetch embedded resources.)
Chances are that the benchmarked application does not run under a fixed URL, e.g. when another dev runs it on her machine. It is hence important to make requests reusable. To allow this the samplers created by the recorder must not contain hard-coded connection details. This can be achieved by adding a config node HTTP Request Defaults to the node that will contain the recorded samplers and enter the values matching your local configuration. JMeter will then leave these fields empty.
To record realistic pauses, JMeter can automatically create timers with the pause times you made while interacting with the site. Add a timer to the recorder but instead of hard-coding the delay enter ${T}. The variable will be replaced by the elapsed wall-clock time since the last response. (The value for the first recorded request might be very long. Make sure to check it!)
Grouping the samplers into logical components helps you to stay on top of things. Under Grouping I usually select Put each group in a new transaction controller; see below under Groups why. Depending on the structure of the tested site, requests that you feel belong together might get split up into different groups. Likewise independent requests might end up in the same. Both can be fixed while editing. But to separate requests into different groups, I found it more practical to quickly restart the recorder. JMeter will then add the new requests to a new group.
Editing
In my experience it is often necessary or at least greatly beneficial to manually edit the recorded samplers.
You will often run your test plan while you are editing it. Note that all individual nodes can be activated and deactivated from their context menu or from the button bar. Add some listeners to see what JMeter is measuring—start with view results tree and view results in table.
Varying Credentials
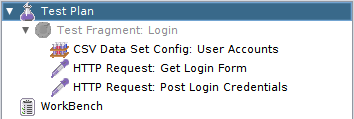
If your application allows users to login, you might want your test plan to do the same. And with different user accounts at that. You can achieve this by telling JMeter to fill the login requests with data from a CSV file with usernames, passwords, and whatever else you need.
First, alter your recorded login requests to use variables like ${username} and ${password} instead of hard-coded values.
Then add a CSV Data Set Config to the node containing the login requests. On the config set Variable Names according to the files structure, e.g. username,password.
Dynamic Requests
It is possible that requests must include some information from a previous response and do not work with hard-coded values. To identify these cases, it might be necessary to restart the application, execute the samplers with JMeter, and observe whether all requests are answered as expected. Also watch your application’s log to see whether it shows signs of problems.
How to create dynamic responses is a topic on its own but this may help you getting started:
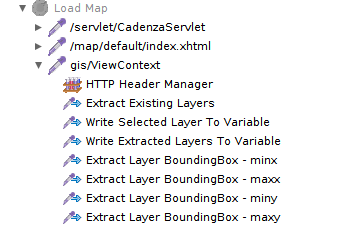
- The post processor XPath Extractor can be used to store parts of a response in variables.
- Variables can be used almost anywhere with
${var_name}. - If values need to be further processed before they become usable, consider the BeanShell PostProcessor that will let you execute Java or JavaScript code in Rhino.
BeanShell scripts have access to several parameters. Variables are stored in Map<String, String> vars and a log4j-Logger named log is also available. Output can be checked by activating the log via Options ~> Log Viewer or the yellow triangle in the top right corner.
Groups
I consider it good practice to isolate parts that can be repeated in different contexts. Prime examples are login and logout, which should be put into their own group.
Here I do not mean a thread group but just “a bunch of controllers”. That can be achieved by moving all controllers into a simple or a transaction controller. These do not change the execution but provide a useful abstraction by collecting controllers that belong together. Give it a good name and it speaks for itself!
I always use a transaction controller for this so that I can get a sample for the total time it took the contained samplers to execute. For this you need to activate the checkbox Generate parent sample in the transaction controller.
After I verified that a group is doing exactly what I want, I usually move it into a properly named test fragment so that I can easily use it from different parts of the test plan without copy-pasting it.
Composing
The last step to a proper test plan is to compose the different parts you recorded, edited, and structured. If you encapsulated individual groups in test fragments, recall that module controllers are used to reference them.
Remember, each thread in a thread group represents one user, so start with creating some thread groups. If your app requires login, this should be the first real action to execute.
You might then want to add some logic controllers that let you arrange the recorded fragments so that they model real user behavior. Maybe include some randomizing elements like the random order controller. If you do so, make sure that your sample size is large enough to not be skewed by a few outliers.
Configuring
Read this super short article to find out how to make JMeter behave more like a real browser.
To let JMeter automatically retrieve embedded resources in parallel, you have to change each HTTP request’s settings under Embedded Resources From HTML Files. This should execute all the requests you excluded during recording.
It might seem unnecessary to first exclude the requests and then configure JMeter to execute them automatically. The difference is that this way JMeter will employ a cache to avoid unnecessary requests and use a pool to execute the required ones in parallel instead of in succession. This models how browsers behave and leads to more realistic measurements.
Benchmarking
As long as you are editing your test plan, you can execute your tests pretty much any way you like. But if you want to actually start benchmarking, there are some additional details to consider.
Read these two lists of best practices to find out what to do and what not to do:
- Best Practices—JMeter Documentation (at least up to 17.7)
- JMeter Best Practices—BlazeMeter
Not mentioned there but also absolutely necessary is to increase the heap space available to JMeter. An easy way to achieve that is to add JVM_ARGS="-Xms2g -Xmx2g" (or whatever heap size makes sense) to the beginning of the jmeter.sh. Be sure to monitor the log to spot OutOfMemoryExceptions.
Next Steps
The official documentation is as exhaustive as is to be expected. Important introductory topics you might want to check out are:
How to compose and execute benchmarks depends a lot on what you want to achieve. Comparing different variants of the same application (e.g. running with different garbage collection settings) is very different from—and much easier than—trying to get absolute numbers (e.g. for an SLA).
This tutorial is just meant to get you started. Make sure to read up on this topic if business decisions are going to be based on the benchmark results.
- List of sources on Stack Exchange: Software Quality Assurance & Testing
- JMeter Load Testing Blog and Resources on BlazeMeter
- JMeter Cookbook by Bayo Erinle
- How NOT to measure latency by Gil Tene
Thanks to my colleagues Boris Terzic and Karsten Schnitter for pointing out problematic and missing bits. All errors are mine.
The title image is called feather sketch and was published by wplynn under CC-BY-ND 2.0.
Share via


