Third Disy Hackathon
We’ve already done this twice (1st, 2nd), so everybody knew the drill: Disy employees of all trades gathered ideas for this year’s hackathon in a Wiki page and then formed small teams around them. As the event approached, regular work almost crawled to a halt with enthusiastic groups busily discussing and planning their pet project.
When Thursday morning finally came, everybody was well prepared and went to work immediately. Here’s what they’re working on.
Lego Resource Planning
We have passion for our work, so we should also be passionate about planning our work! We are 15 people who need to plan tasks in up to 40 projects/accounts for a period of 3 months. JIRA does not compute here. Excel computes bad mood (and loads of tedious work in maintaining). No, we need a planning tool that is pure fun, then doing the planned will be even more fun! 😉
Gamification is the key! Digital natives are going the analogue way… and then of course they digitize it!
We will build a wall-mounted Lego resource planing board and put a lot of colored blocks on it (because that’s what our tasks are, basically…). But now we have a lot of separate colored blocks (remember? 15 people on 40+ projects for 12 weeks = a zillion tasks!) and 2 minutes later nobody knows which blocks represents what… what now?
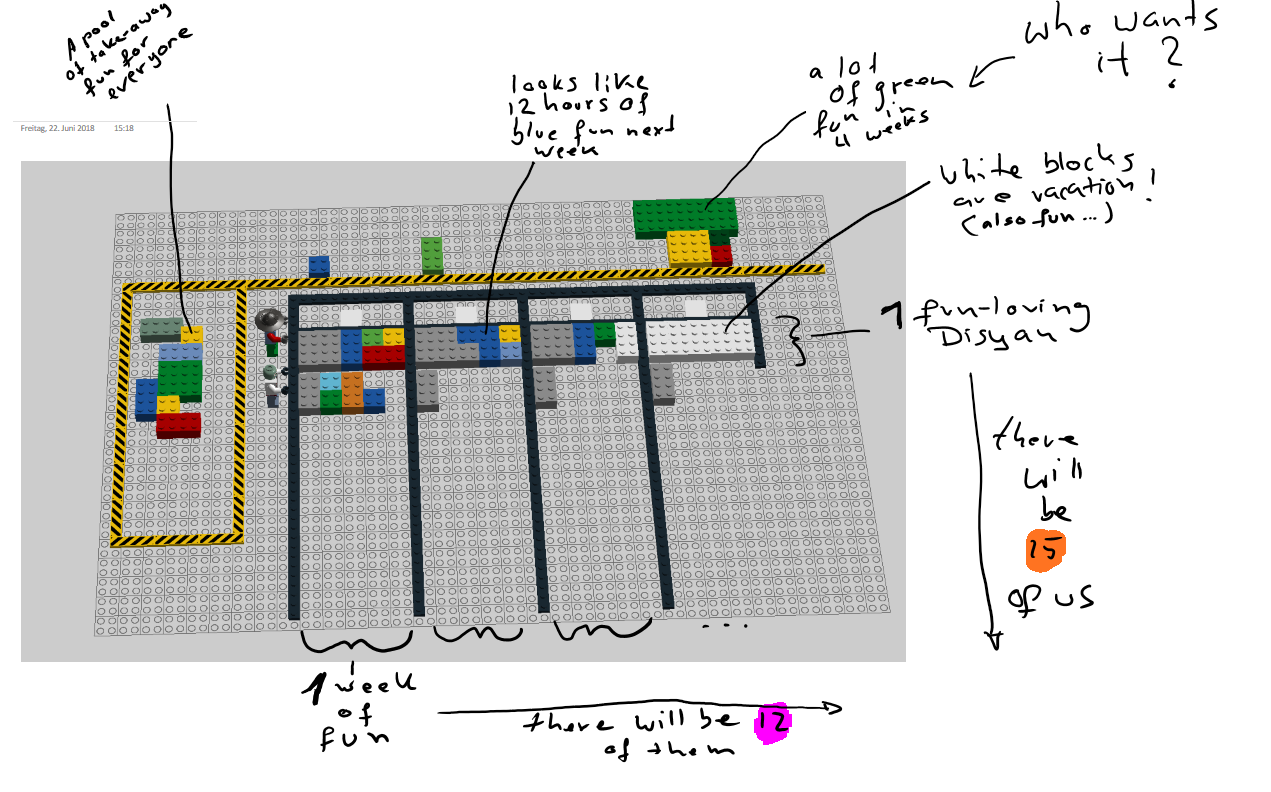
Stay analogue and write down every block’s meaning on a piece of something? Could do… but seriously? I mean, seriously?
Would it not be way more fun to install a camera in front of the board and capture the frickin’ blocks!? Some object detection and classification will help us build a neat little digital twin of the planning board and an assistant GUI of insane usability will allow us to label each digital block representation with a short but meaningful task name.
Et voilá: You want to know what that nice little greenish 8-hour block means, that sits in your friend’s lane 3 weeks ahead…? Just ask the app!
Everyone will be so happy! 🙂 😀 😛
And on the second day we’ll go full augmented reality: You simply point your phone’s camera at the board and it overlays with the information you need. (What do you mean, “a tad optimistic?” 😉)
Connect Cadenza with Elasticsaerch
Elasticsearch is a search engine based on Lucene and NoSQL database technology that aims to handle big data. It is optimized for distributed systems and tasks like aggregations and full text search can be performed very efficiently. It is thus suitable to perform real-time data analysis and a modern REST API allows easy usage and connection to other systems.
The current version of Elasticsearch allows sending requests as classic SQL queries. Since Cadenza has strong SQL capabilities, we chose this point to connect both systems and explore how we can combine their advantages.
After investigating and evaluating Elasticsearch’s features, we integrated it with Cadenza, more precisely, we use Cadenza’s SQL statement query builder. In a first step we send a request to Elasticsearch to receive a fast response. This response can then be imported into Cadenza as a table to exploit its full feature set like maps or diagrams.
In the end, we would like to demonstrate the general capability of the connection with data from Twitter. In the future we expect to develop features to execute more complex SQL statements in Cadenza, send them to Elasticsearch and visualize them.
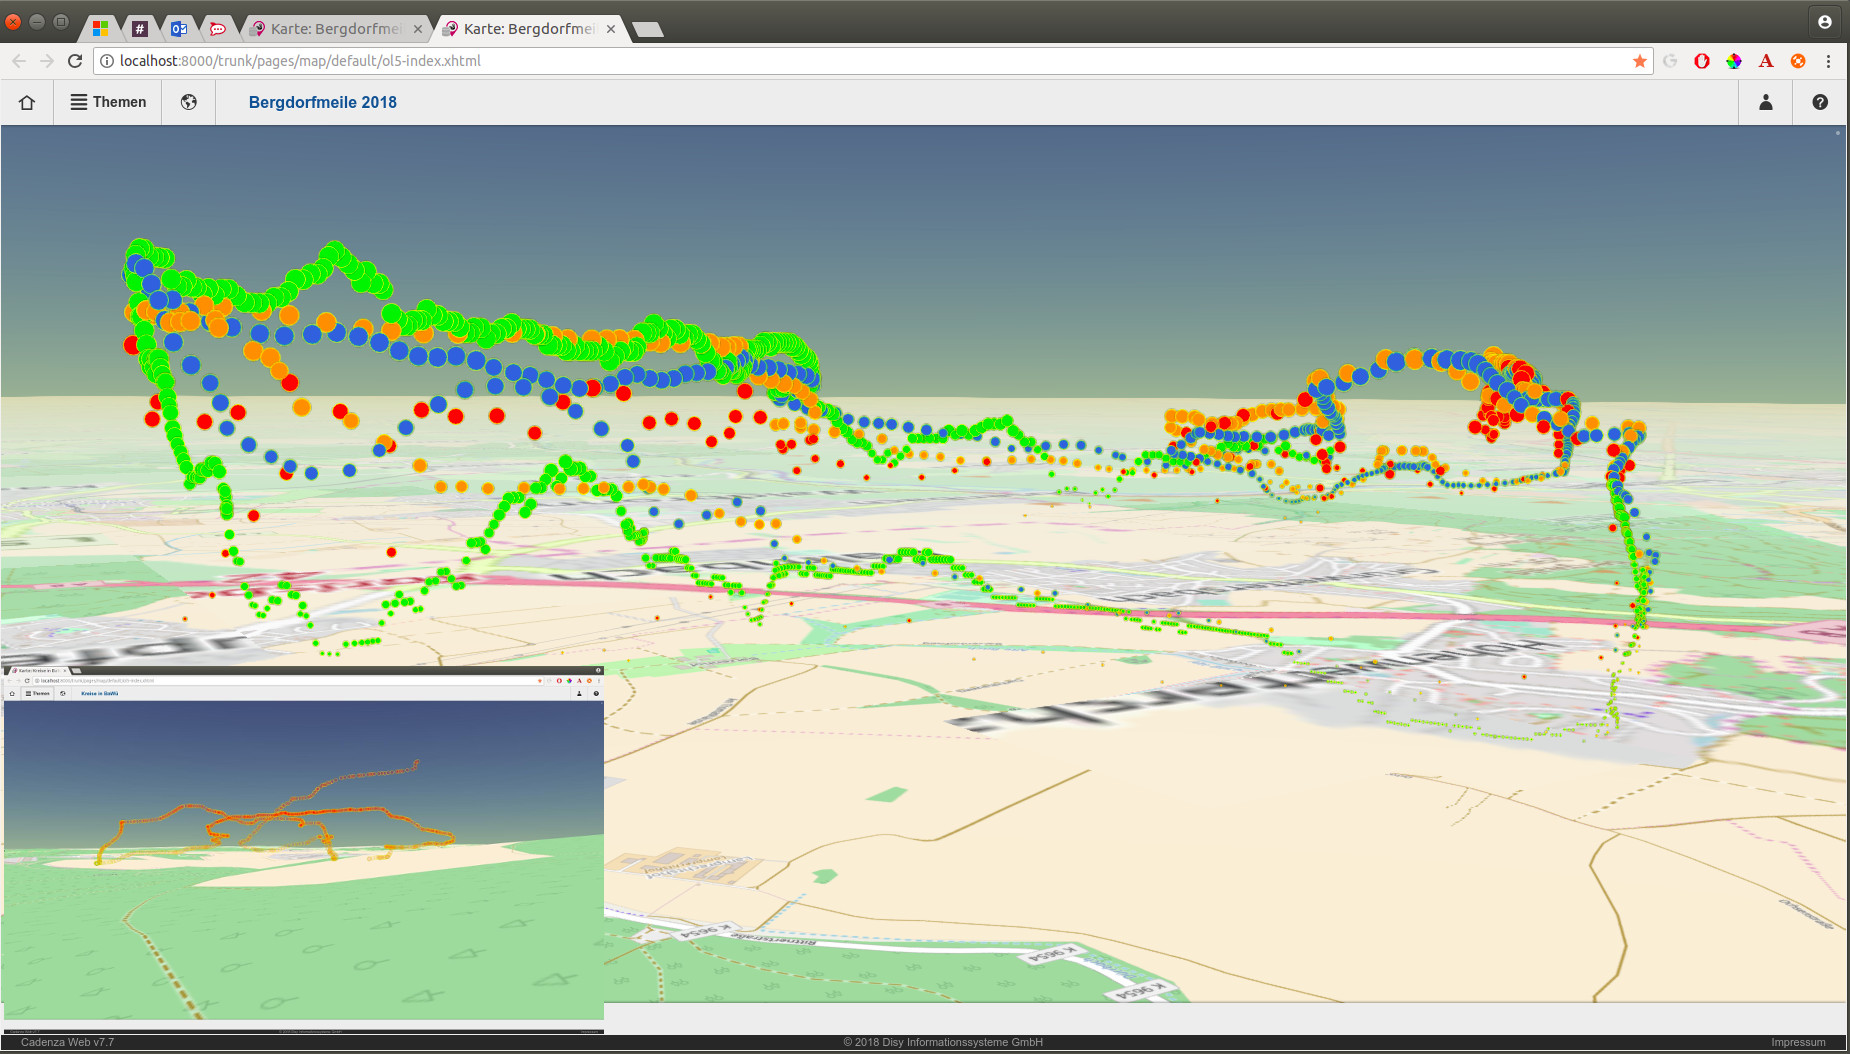
3D-GPS Tracks in Open Layers 5
3D GPS-tracks on a map? It’s possible with Cesium and Open Layers 5!
Cesium is a Javascript library that allows you to create 3D globes and maps. You can plug in custom imagery, terrain, and 3D models to be displayed on the map. Our goal is to allow customers to visualize their geo data from a different perspective by allowing them to project it on a 3D map.
Visualizing Live Traffic Data in Cadenza
Live data. A society that is drowning in a stream of information is dreaming of being able to have all relevant data available immediately and have it visualized in a helpful and convenient way. That’s why we looked out for some data sources that supply live data in a free and simple way and found quite a few promising REST APIs:
- Deutsche Bahn’s OpenData project lets you look at the train station boards and get information about schedules
- Twitter’s API would get you information about trending tweets and much more
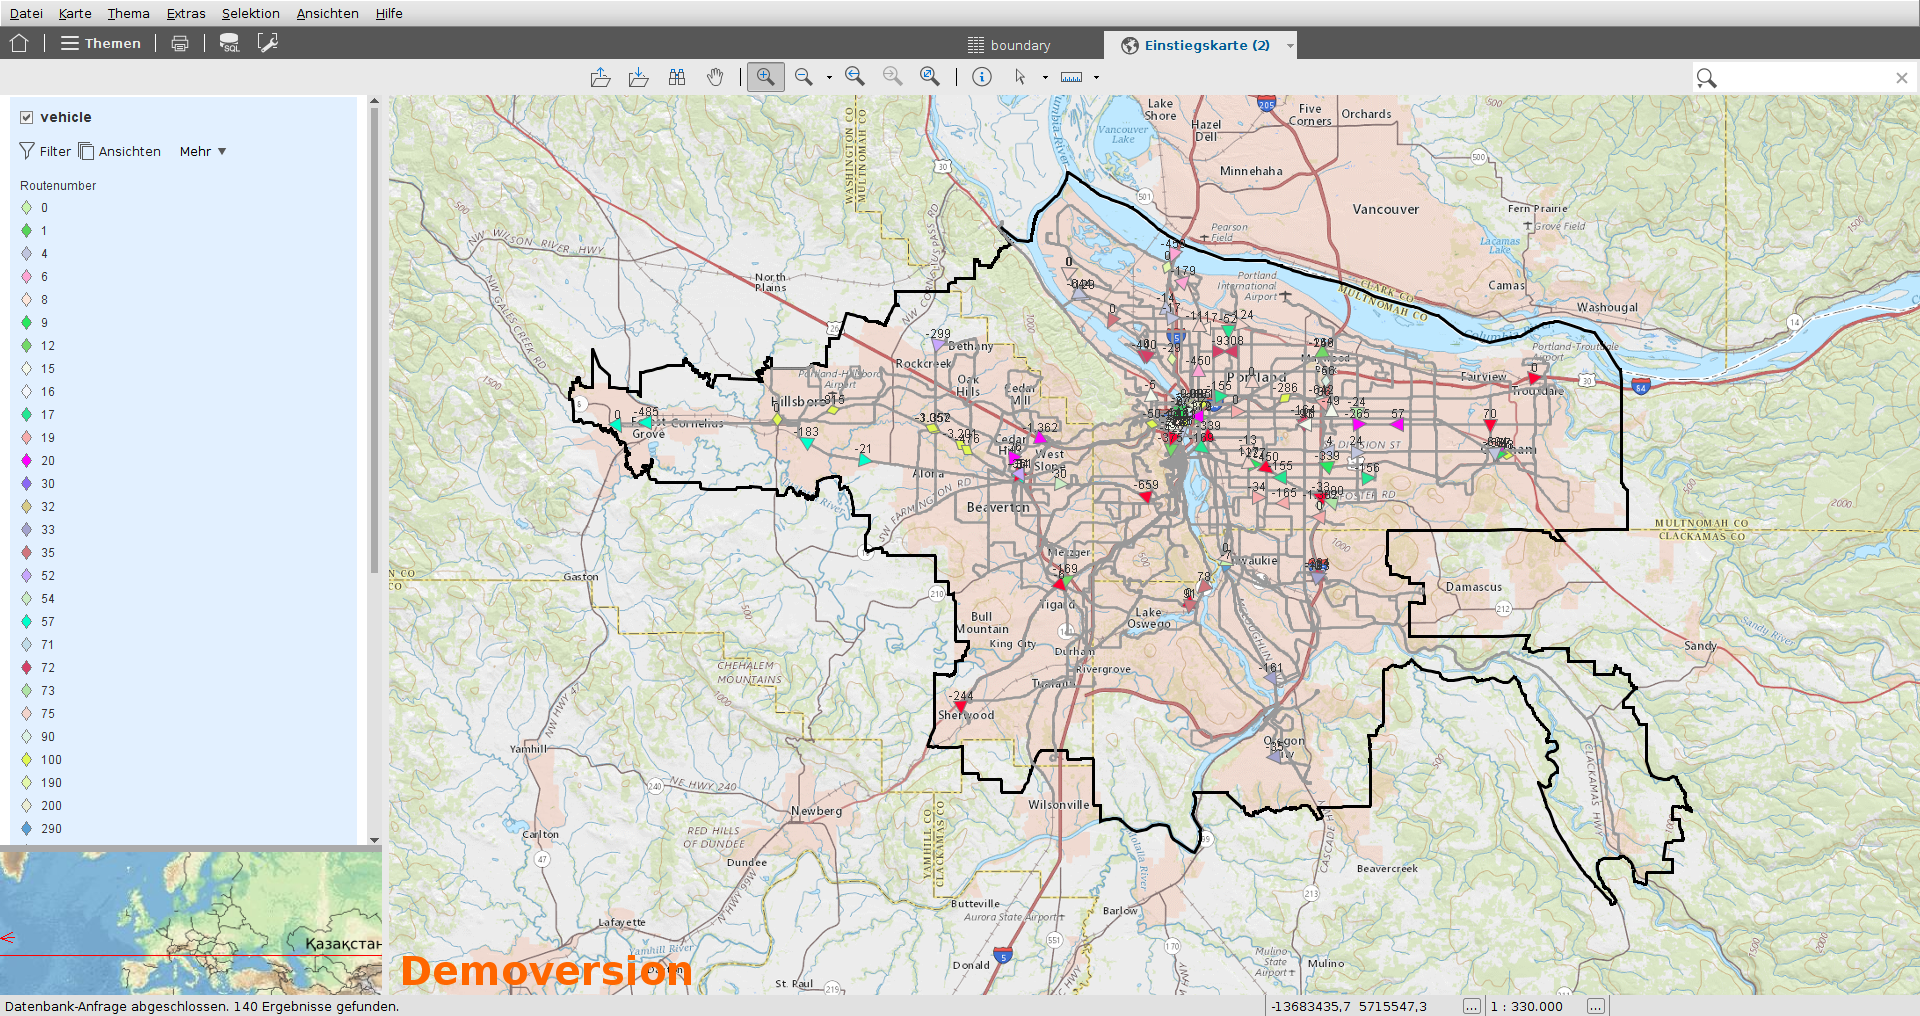
In the end we decided on a service offered by the Oregon railway company. There we had actual spatial data (yay!) of buses and local trains together with a lot of other information, all with a simple REST GET.
We set up a Python script to get us the data and write it into a SpatiaLite database. This allows us to make additional calculations and ensures we do not get drowned in information. The time delay of 9 hours was quite noticeable though: Around noon in Germany there was almost no traffic with only 3 nightlines running and at some point stopping completely - as you can imagine, that made testing quite difficult. When Portland woke up, it quickly started climbing to 500 different vehicles.
Satellite Images with Copernicus
Let us inflame Cadenza’s passion for the latest remote sensing data provided by the European earth observation program, Copernicus! Powered by six Sentinel satellites, the program aims to provide independent access to information for environmental and even security-related questions and use cases.
Data collected by numerous sensors (like a synthetic-aperture radar, multi-spectral instruments, radar altimeters, and a temperature radiometer) is provided within only a few hours after observation and can be obtained for free from the Copernicus Open Access Hub. Its OpenDataProtocol and OpenSearch APIs enable us to connect with Cadenza / Talend and use our own abilities to browse, visualize and analyze satellite imagery.
For the hackathon, we envisioned being able to include current Sentinel-2 natural color images in cadenza for a custom region. This can be realized via drawing a bounding box in Cadenza. The bounding box coordinates are sent to a database in which the metadata of available Sentinel-2 images is already stored. The intersection of the custom bounding box and the bounding boxes of the satellite images returns the required images id. This information is necessary to download satellite images of the custom region via Talend.
Each Sentinel-2 product consists of eleven spectral bands, which are presented in eleven JPEG2000 encoded files. Through the combination of the necessary bands, true color images are computed into a single geo-referenced TIFF file and finally get warped into a uniform map projection. The processed satellite image is included in Cadenza with the help of Talend, which adapts the current repository. At this point, the latest satellite imagery is shown in Cadenza’s map view.
These data enables monitoring of environmental changes in short time-steps, for example to identify unauthorized waste dumps or to keep track of forest fires and erupting volcanoes. Up-to-date information helps to identify disaster areas from tsunamis and earthquakes thus enabling the efficient coordination of international disaster response and task forces.
However, satellite imagery may also be used as a background map. With additional shading from a digital elevation model, the map will look even more realistic. As a special feature, we examined the use of the new time slider with Sentinel-2 images which shows different time steps of the same region.
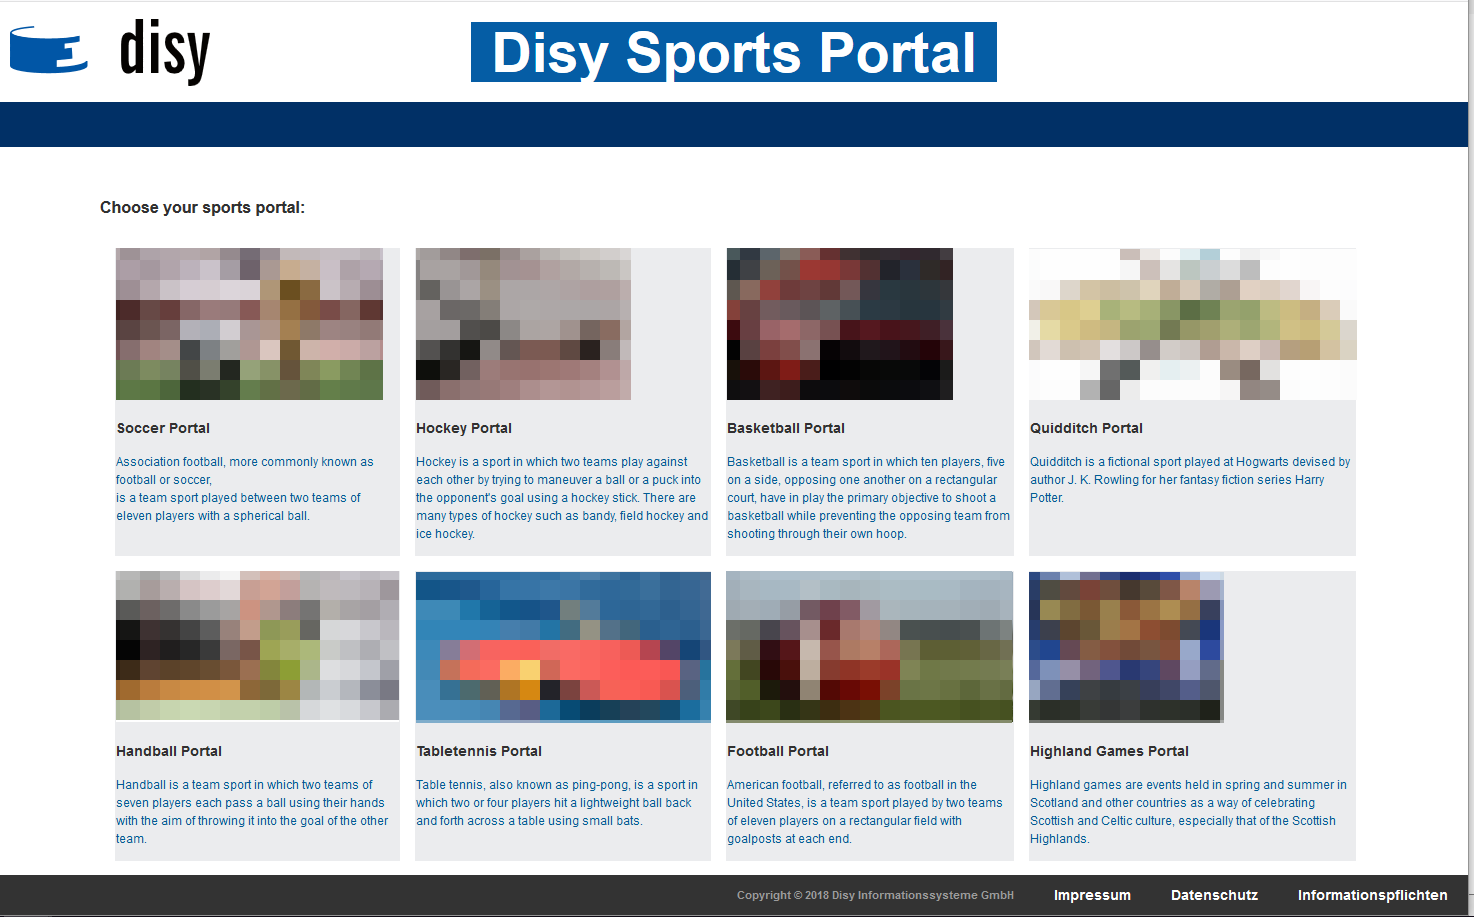
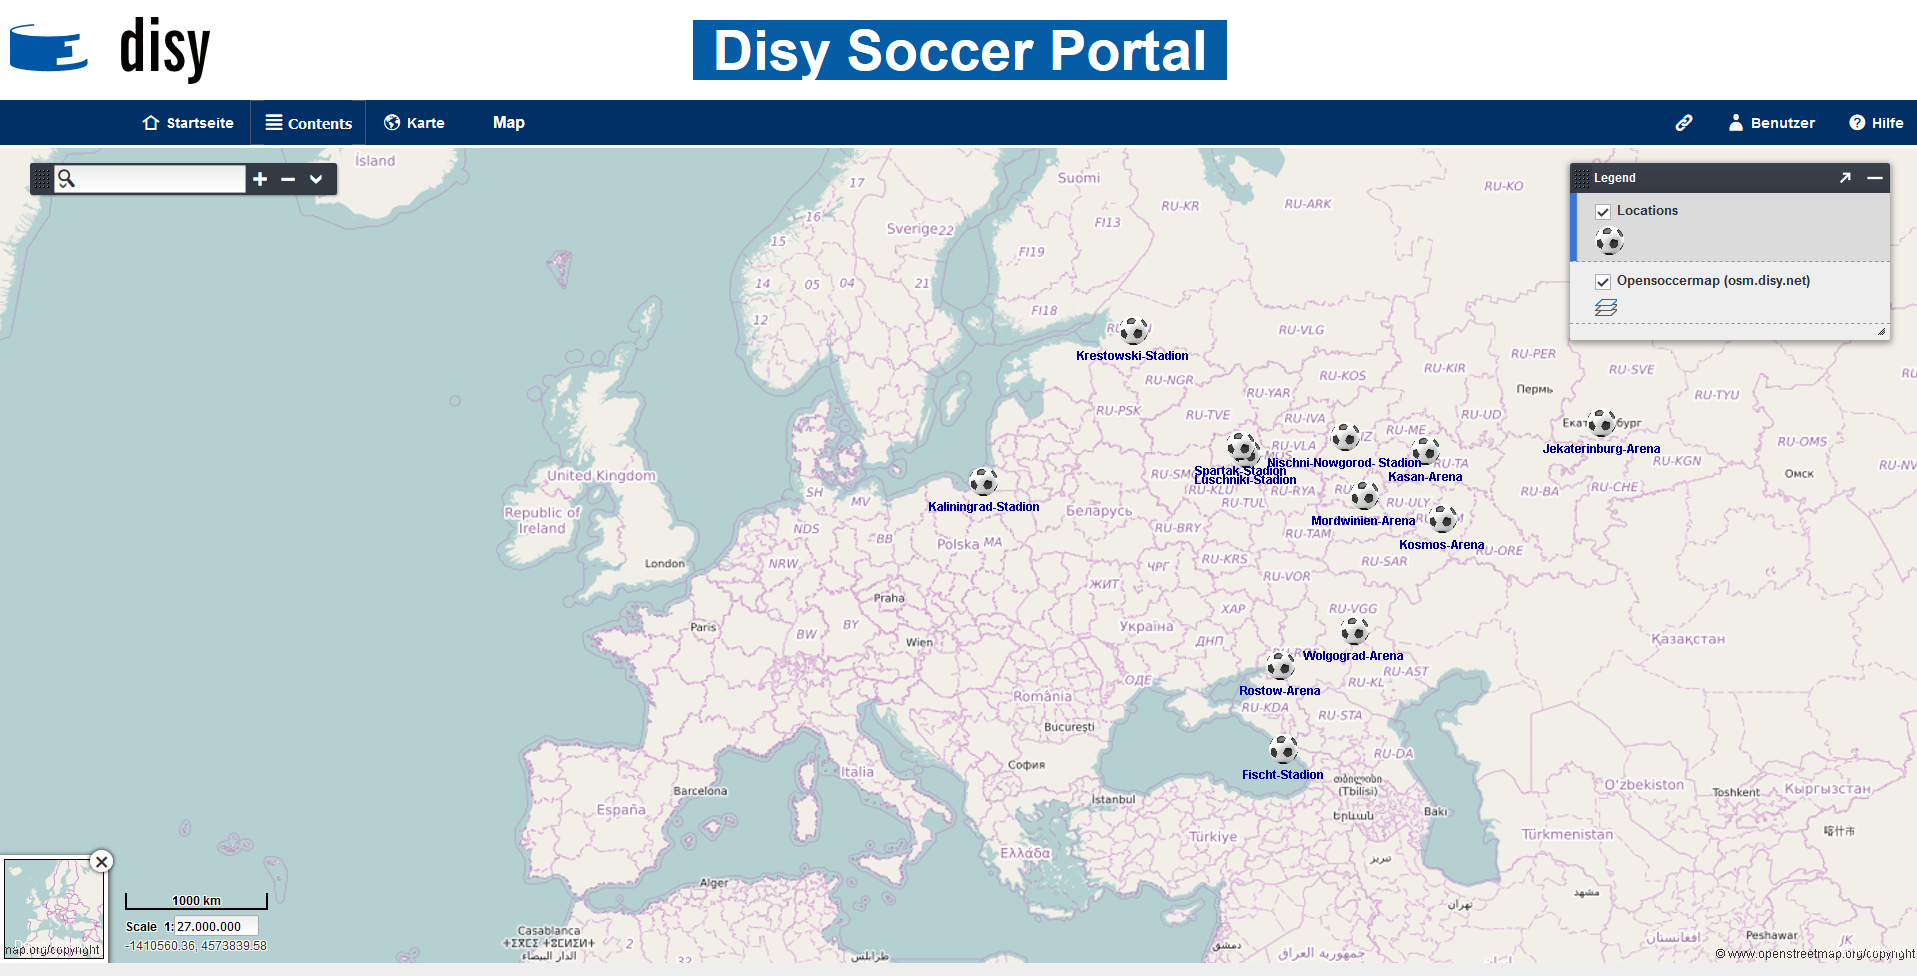
Disy Sports Portal
Football (and more) is coming home, to Disy. We like playing football, training for the highland games, and everything else that sport has to offer. The following idea grew among us: Let’s analyze Sport results with Cadenza!
We used community-based data from OpenLigaDB, a page where results are curated by the community and made available via a REST API. Chief among them, of course the results from the ongoing 2018 football world cup.
With Talend Open Studio we built an ETL Process to automatically import all data, which is provided as JSON, into our Oracle database. Afterwards we configured Cadenza Web to show the data. Next we are going to collect our own sports data and analyze it to win more challenges and be smart & sexy and by now … sporty!
What’s next?
Later today, all participants and the jury will come together to present each project and vote for their favorites. Last year, first prize was a full-day team-building event, which was a blast, so we’re going to do the same this year.
Good luck, everybody!
Share via


