Spatial-ETL with Talend exemplified
With the increased availability of data though sensors, inter-connected mobile devices, social media and private or public spatial data sets, the demand for a seamless integration of spatial information into data-driven decision-making processes has reached a new high. Spatial data with their diversity of formats and spatial reference systems and their specific geometrical operations have been historically managed separately while being only occasionally, if at all, considered in traditional data integration processes.
In this article, we would like to show a concrete example of how to easily enrich your ETL-processes with spatial data. If you wish to try it out on your own, you can use a current version of Talend Open Studio and additionally download and install the Plugin GeoSpatial Integration for Talend for free. The plugin extends Talend’s data sources by providing access to spatial databases and formats, such as Oracle Locator/Spatial, PostGIS, SpatiaLite, Shape Files and Well-known text (WKT). In addition, the plugin extends the palette of Talend’s components with a full set of geometrical operators such as area or length calculators, buffers, centroid, envelopes, intersections and many more to automate spatial tasks and workflows.
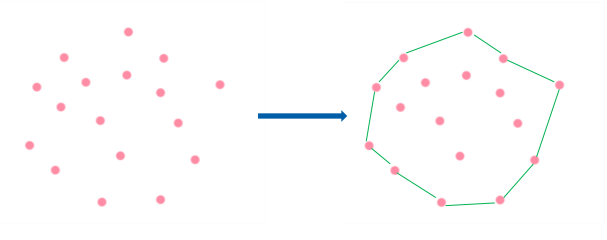
To demonstrate the functionality, let’s have a look at the following small scenario with wind farms: The individual turbines of the wind farms are available as single location objects (points) and we would like to calculate the full area of the wind farm (or to speak in geometrical terms: to calculate the convex hull of all points belonging to one wind farm location and hence grouped by an attribute). This exercise includes the following steps:
- Define the metadata for our new data source (shape file)
- Define the Talend job to calculate the wind farm area by applying a geometrical operation
- Execute the job and write the resulting areas in a file or database.
This simple process allows users to define and visualize the wind farms’ expansion area, where the group of wind turbines is located, and thus create the basis for further planning steps in the fields of road construction or nature conservation.
Step 1: Define the Metadata to load the Geometries from a file or database.
First, we have to register the new data source we want to read. In our case it is the shape file with the wind turbine location information. If you have spatial data in another format or spatial database like Oracle Spatial or PostgreSQL with PostGIS, the process is very similar.
Next, we have to define the metadata for our new data source in Talend as follows. This way, we can use this data source for the example-job and any other future jobs.
- Specify the name and purpose.
- Select a path to the source file with the wind turbines. If the shape file has a project-file (.prj) the coordinate reference system is automatically identified and assigned. In other cases, you can enter it manually.
- Edit the schema.
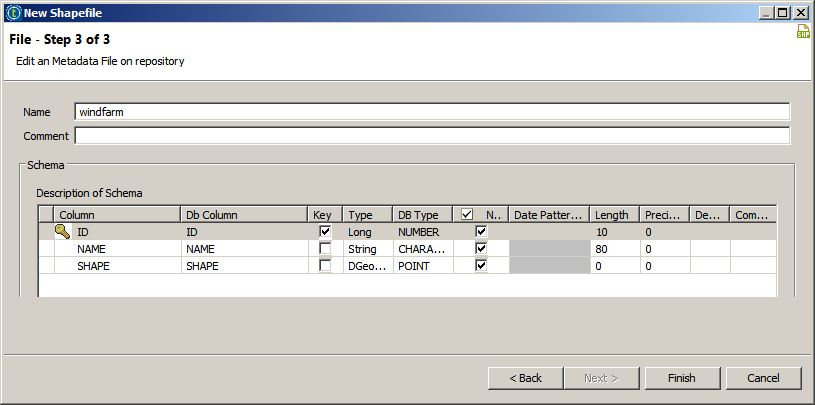
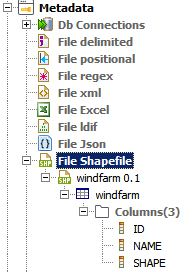
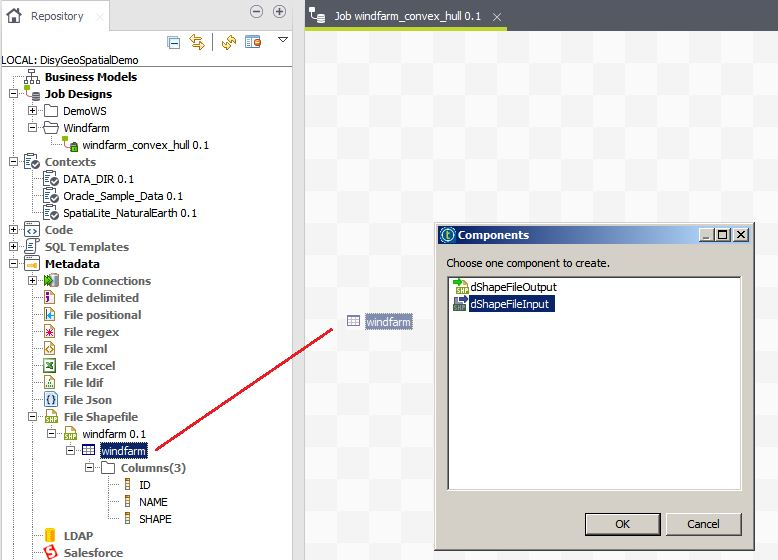
The shapefile has now been included in the Talend metadata and can be used for the next step or for any other job you want to start with this data. After this step metadata-tree should look like this in Talend Open Studio:
Step 2: Create a Talend Job including the spatial operators.
In this step, our aim is to generate a geometry that covers all wind turbines and to create a convex hull around all wind turbines using the geometry functions as illustrated below:
To do so, you have to create a new Job in Talend and enter a name, purpose and description for it.
Then drag the new data source, “windfarm” (created in the previous step), and drop it to the job’s workspace.
A dialog window will open automatically.
You can now choose a component you wish to use. Since we are working with a shape file, select dShapeFileInput.
The shape file with our wind turbines is now ready to be further processed.
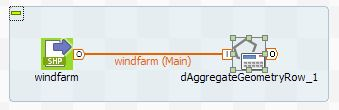
Since we want to calculate the convex hull (wind park area) of our points, select the new dAggregateGeometryRow component, move it to the job’s workspace as well and choose the “main-row” connection between the dShapeInput and the dAggregateGeometryRow components.
Finally, we have to define the output.
In our case, the output is a simple shape-file containing just the name of the wind park and the new geometries created.
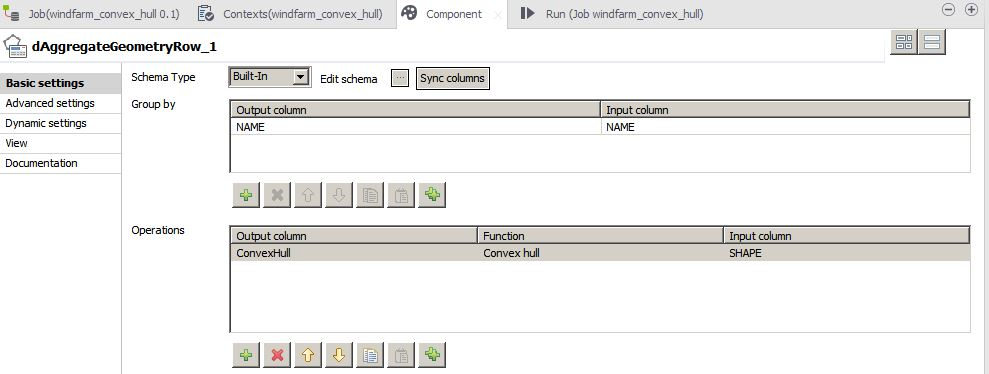
Hence, select the dAggregateGeometryRow component and navigate to the “Component” tab.
Click the “EditSchema” button in order to define the component’s output schema.
By clicking the “Add” button (“+” symbol) we create two new columns „Name“ (Type: STRING, Length: 80) and “ConvexHull“ (Type: DGeometry).
As our source file contains points from different wind parks and we want to generate a convex hull from wind turbines pertaining to each wind park, the wind turbine points need to be grouped by the name of each Wind park.
This can be accomplished by setting the “Group by” property of the component dAggregateGeometryRow_1 to “NAME” column:
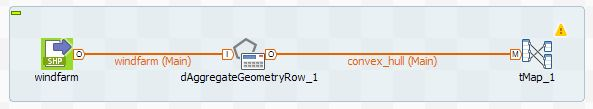
Add a tMap component to the workspace and create a main-row link between the dAggregateGeometryRow and the tMap component as follows:
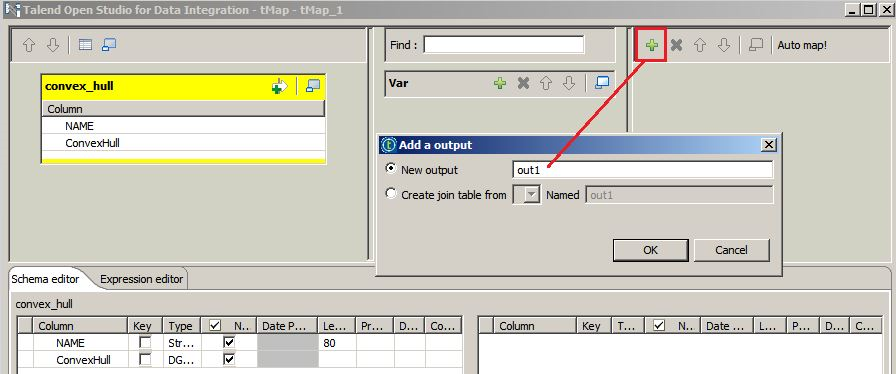
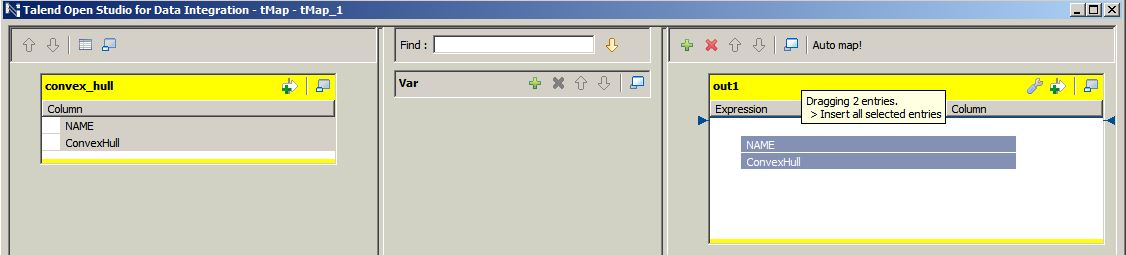
Open the tMap component by double-clicking it, create a new output data stream and call it “Out1“, for instance.
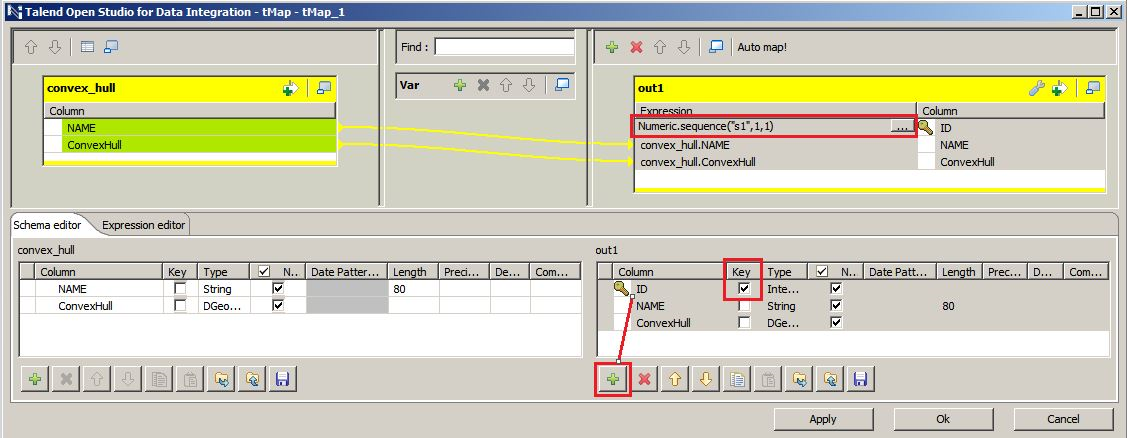
Now we can map the input data stream via drag & drop to the output data stream as shown below.
It is recommended that you create a unique identifier for all output data sets.
In our example, we hence create a new “ID” column for the unique identifier as an Integer data type by using the Numeric.sequence("s1",1,1) function:
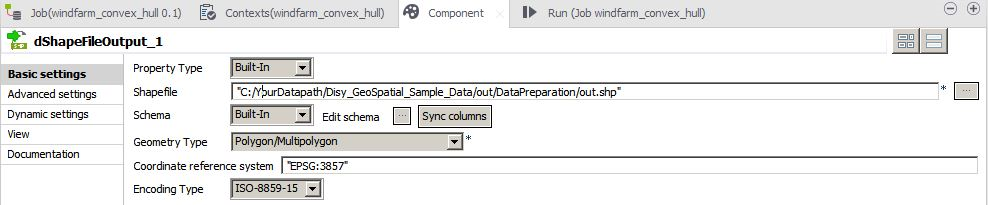
The newly created spatial and attribute data shall be saved as shapefile. For this, we can use the new dShapefileOutput component as follows.
To customize the Output-Stream, navigate to Component properties and select the storage location of the shapefile. Also select the same coordinate reference system as defined in the data source. In our example it is EPSG:3857 (a.k.a WGS84 or Web Mercator).
Step 3: Execute the job and write the resulting areas in a file or database.
That’s it! Now you can run the job and the output files will be saved to the file you specified for further use.
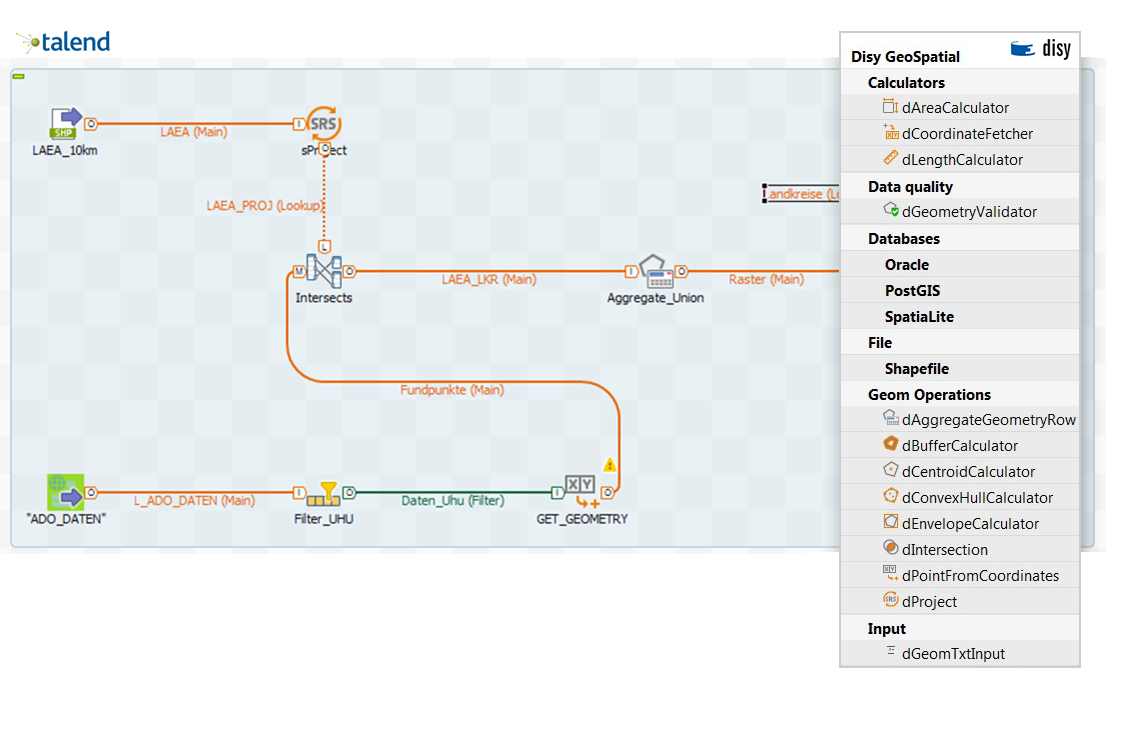
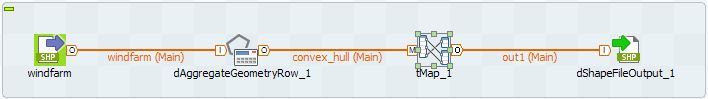
After the execution of your job, your ETL process should now look like this:
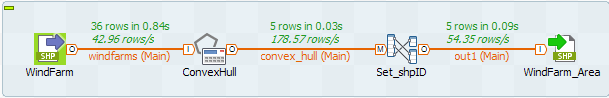
Congratulations! You just processed your first Spatial ETL job without leaving Talend Open Studio.
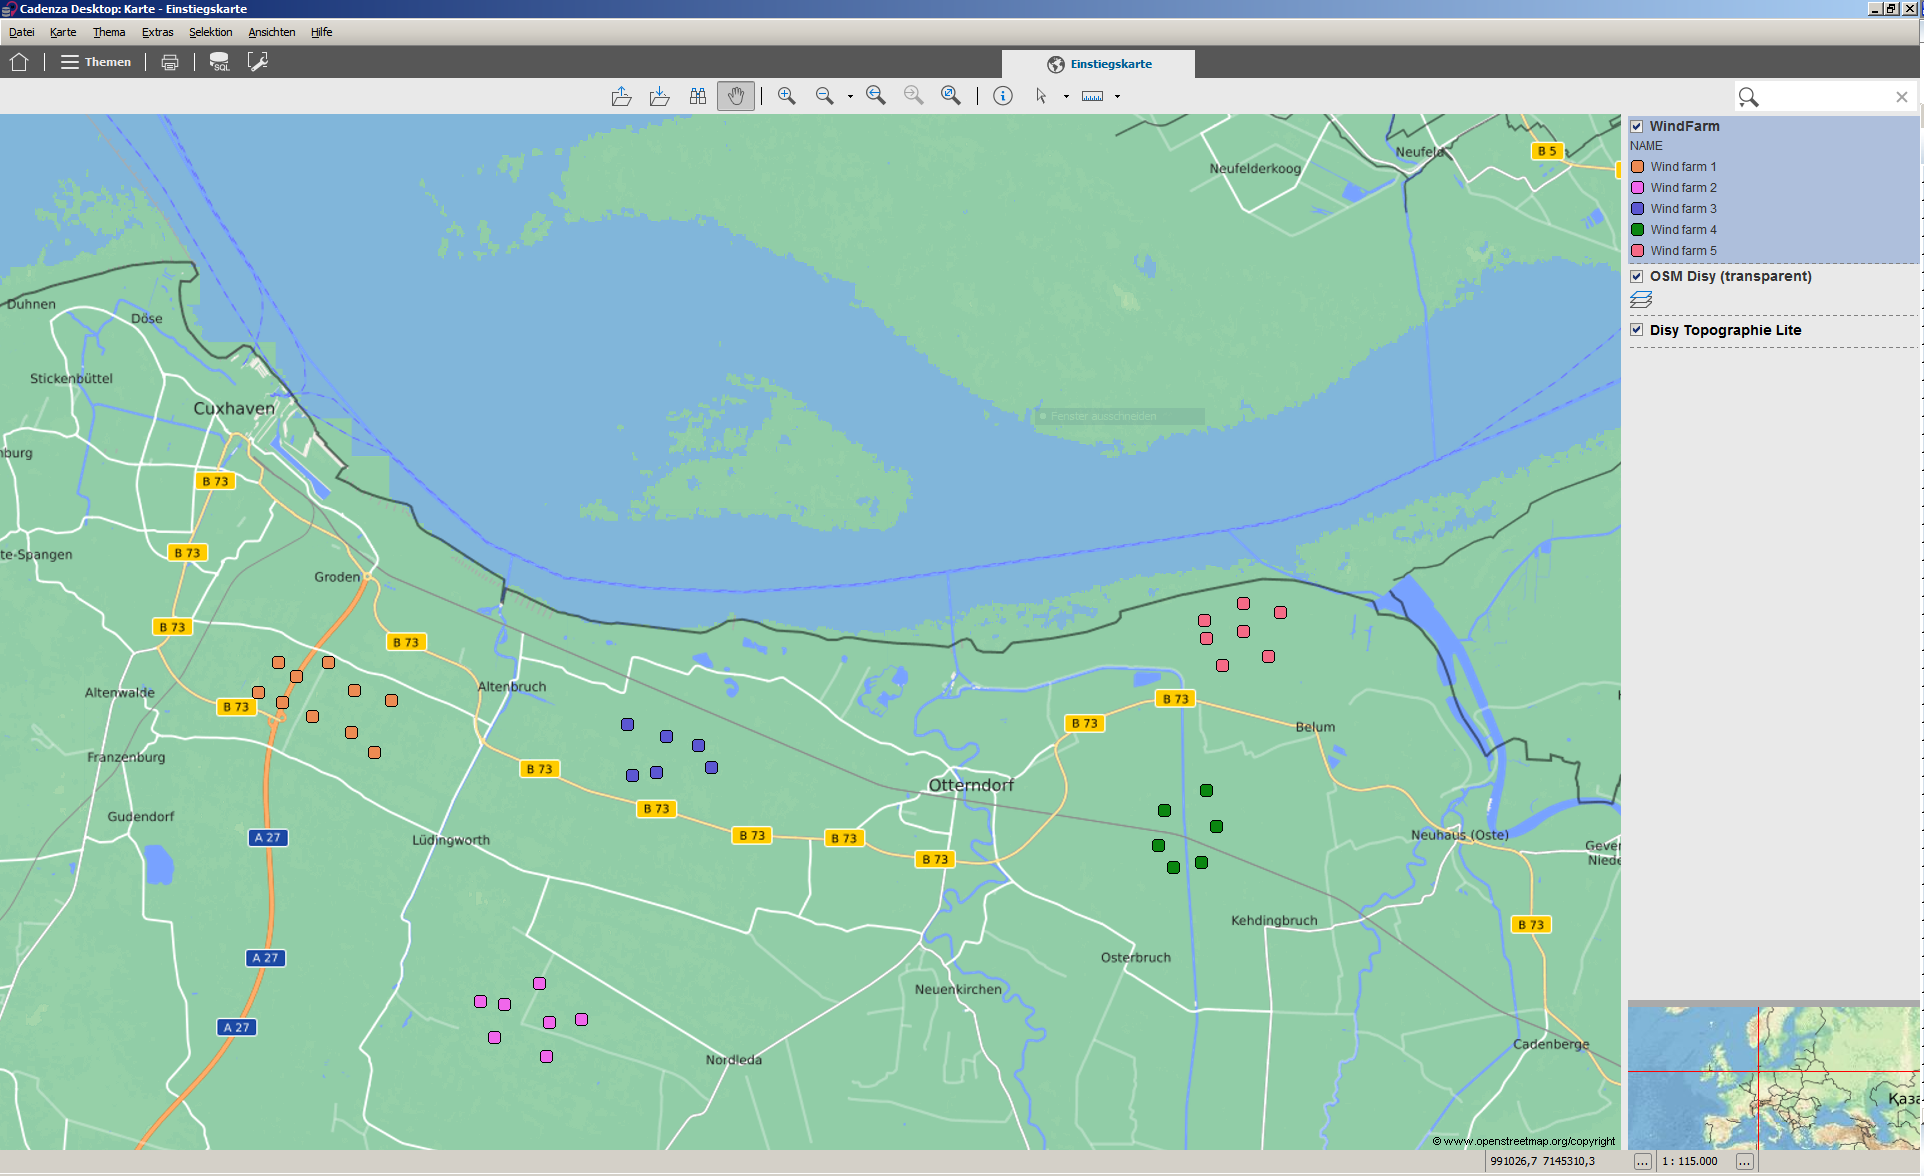
For the purpose of demonstration of the result, the screenshot below shows the newly created areas added in our software Cadenza:
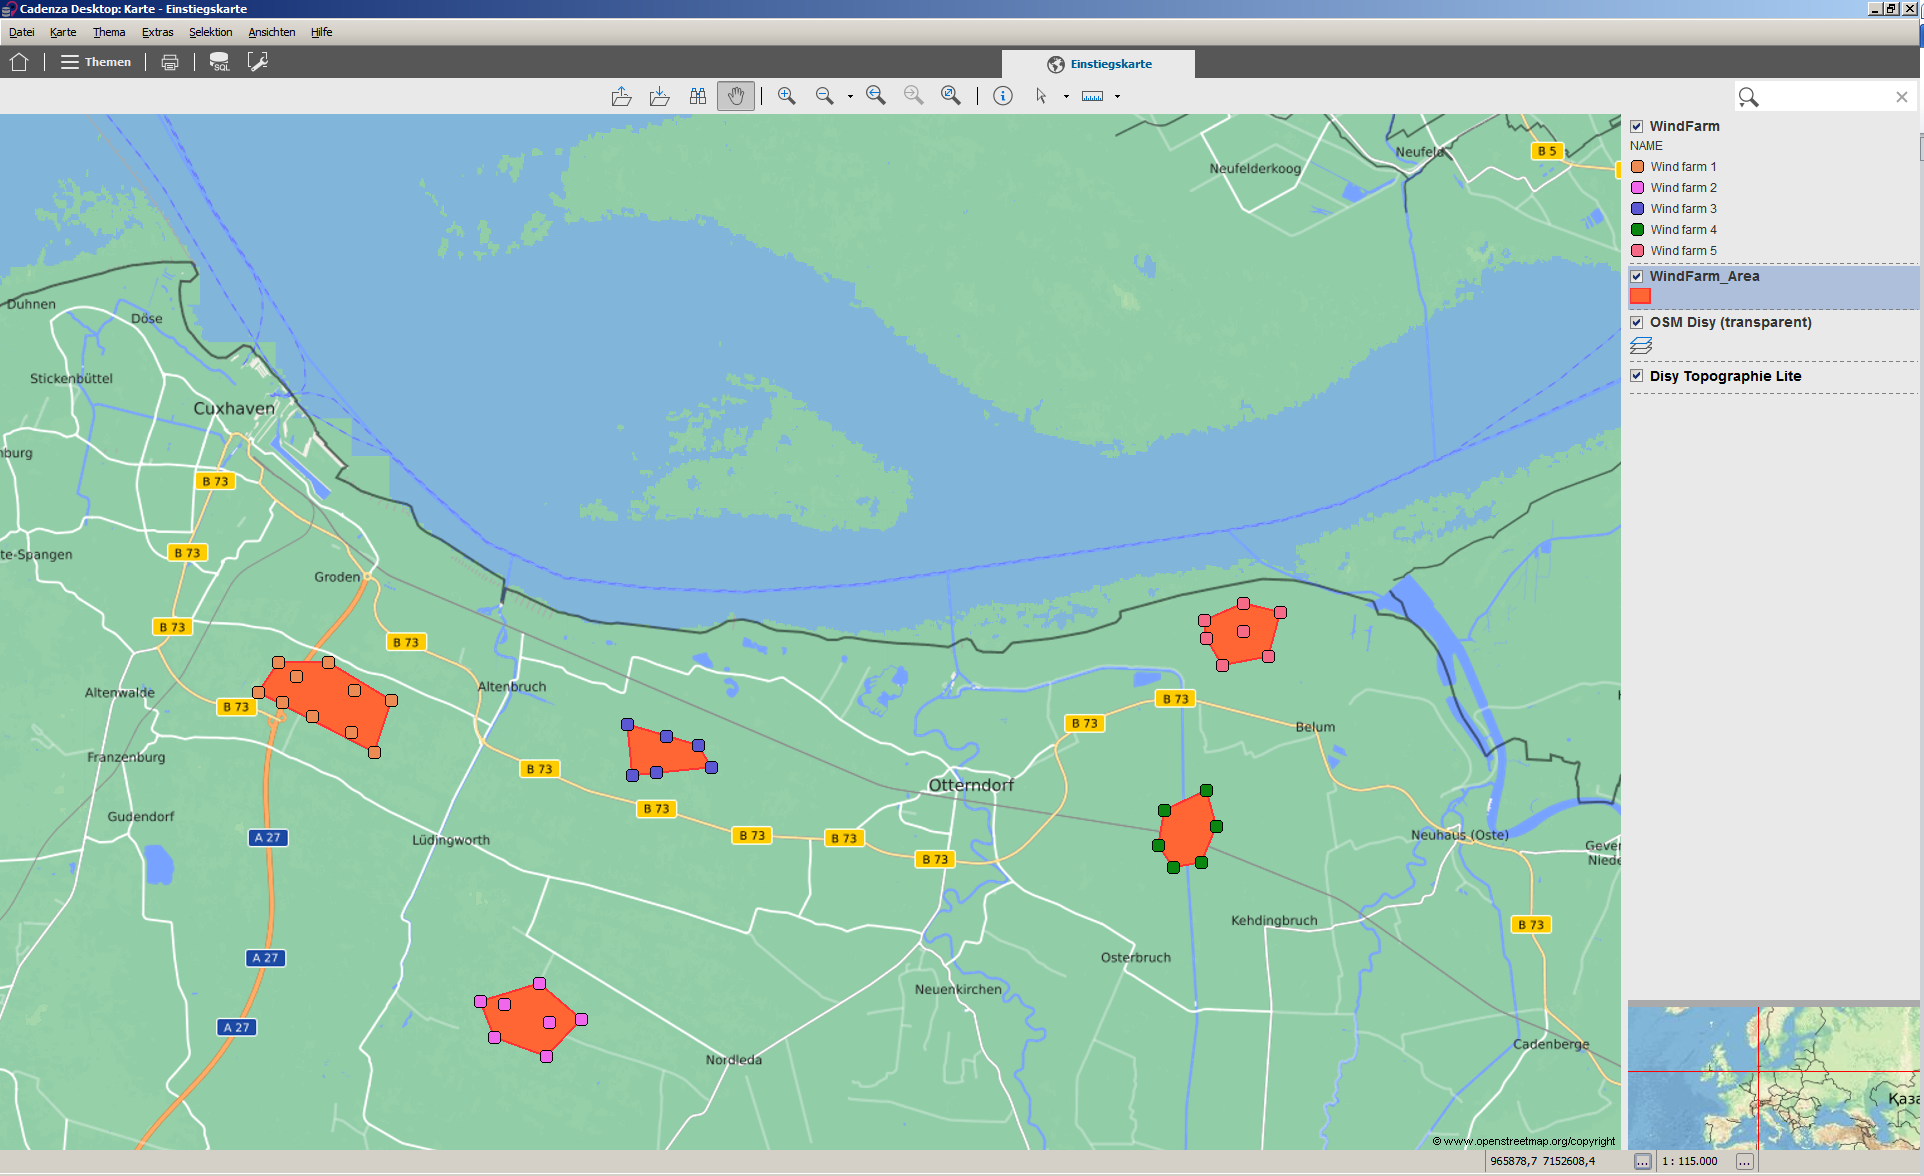
As you can see, the new areas (the wind parks) are created including all single wind turbines of an area.
If you want to try it out, you can download the current version of the plugin here. In the download-file you will find additional samples and a full documentation to experiment with Spatial-ETL.
Share via


